Market Volatility Update

August 7, 2024
The recent selloff in global markets has triggered some concerning headlines, being the biggest drop in Japanese stocks since 1987 and the highest reading of the VIX index (a measure of volatility and fear) since the COVID-19 pandemic. As is the case with most stock market selloffs historically, there are multiple factors at play and the selling was most likely attributable to the confluence of these events. The result was a dramatic shift in market sentiment, which had been extremely optimistic and now seems uncertain to the point of full-on fear. Now investors must assess the reaction and the aftermath and decide whether this was an isolated selloff or the start of a broader downturn. To do so, we should look at each of the possible triggers and how they came together to cause such a dramatic repricing of risk in the markets and assess whether each is cause for greater concern.
Cause #1 – The Carry Trade Unwind
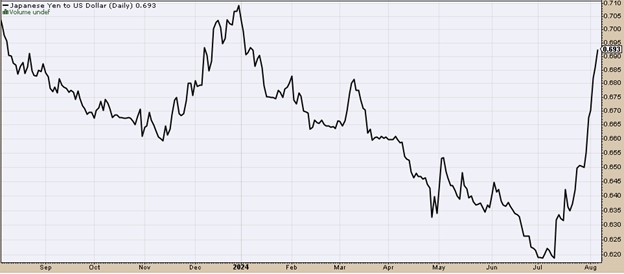
Japanese stocks had been a market outperformer for well over a year, thanks in no small part to lower relative inflation that allowed the Bank of Japan (BOJ) to keep rates at zero while other central banks hiked aggressively to control inflation. Wherever and whenever arbitrage opportunities exist, investors will take advantage. Hedge funds were happy to borrow in Yen – and pay those unusually low interest rates to the Japanese lenders they borrowed from – and then exchange those funds to USD and other currencies to invest in assets denominated in other currencies, a process known as the “carry trade”. These investments frequently involved the use of leverage to boost returns. When the Bank of Japan pivoted to hiking rates, those traders scrambled to unwind the carry trade, selling the assets, in this case stocks, and converting the proceeds to Yen – buying Yen – to then pay off their Yen-denominated loans. This unwind accelerated the losses as the demand for Yen pushed the value of the currency even higher, forcing carry traders to sell even more of their leveraged positions.
Figure 1. Japanese Yen to US Dollar, One-Year Chart

The Verdict – A major event, but an isolated one that should be resolved as investors unwind their trades.
Cause #2 – US Economic Concerns
The US economy has been running smoothly and frankly, making most economists and even the Federal Reserve look foolish over the last year and a half. Recall nearly every Wall Street bank and most economists called for a Recession in 2023 and cooling GDP growth in 2024. Yet in the second quarter GDP accelerated to 2.8%, largely thanks to consumer spending. A strong jobs market has kept recession fears at bay and given the Fed extra time to wait for its historic rate hikes to work their way through the economy. Investors have short memories; only a week ago many investors were clamoring for higher unemployment to push the Fed into cutting sooner. Investors got their wish as the July jobs report released last Friday showed unemployment rose to 4.3% and just 114,000 additions to nonfarm payrolls.
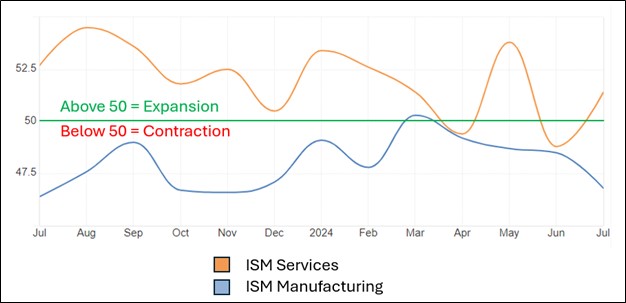
Prior to the July jobs report, the ISM Manufacturing report also showed weakness, slipping further into contraction at 46.8. Investors saw two consecutive poor economic data points and, with no Fed meeting on the calendar in August, began to panic. The narrative that emerged was that the Fed had missed its window to gradually lower rates by 25 basis points, and now would have to issue a 50-basis point cut in September, or possibly even an emergency cut.
Yet, manufacturing is not the entirety of the US economy. In fact, manufacturing accounts for $2.9 trillion of US GDP, or just over 10 percent. While 10 percent of GDP is nothing to ignore, it is dwarfed by the service sector at 70% of GDP. On Monday, amidst the worst of the selling, the corresponding ISM Services report came out showing an expansionary jump from 48.8 to 51.4, backed by strong business investment. The strong services data helped keep the market meltdown from getting out of hand and shows at least one added data point indicating that panic over an imminent recession was overblown.
Figure 2. ISM Services and Manufacturing PMI

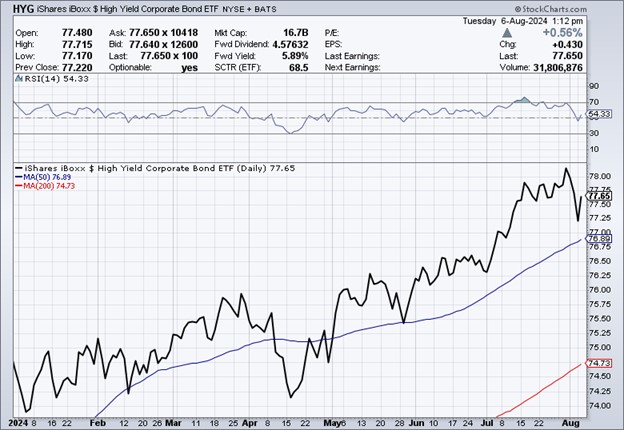
Furthermore, the high yield market showed little panic, indicating the risk of defaults, which would normally jump if a recession were so assured, was still very low. Using the old cliché on Wall Street, that bond market is smarter than stock market, high yields say to hold stocks here.
Figure 3. High Yield Bond (Ticker: HYG) Year to Date Performance

The Verdict – Cooling economic activity without a recession is a positive sign on the inflation front, and something the Fed has been trying to achieve.
Cause #3 – A Normal, Healthy Correction
US stock markets have been on “easy mode” all year and, as we have noted in prior commentary, they have become increasingly imbalanced with mega-cap tech accounting for most of the gains. The crowded big-tech AI trade had pushed companies like Nvidia (NVDA), Apple (AAPL), and Microsoft (MSFT) to unprecedented valuations in the trillions of dollars. These same companies just so happen to be the ones that many hedge funds piled into via the carry trade.
In many ways, the run up has been justified. Mega cap tech companies are undeniably printing money. Apple alone recorded nearly $86 billion in revenue and over $21 billion in net income in the second quarter. Nvidia, which has yet to report Q2 earnings, increased its net income by over 628% year-over-year in the first quarter. Furthermore, these companies are investing at a frenetic pace in artificial intelligence which has already boosted their bottom lines.
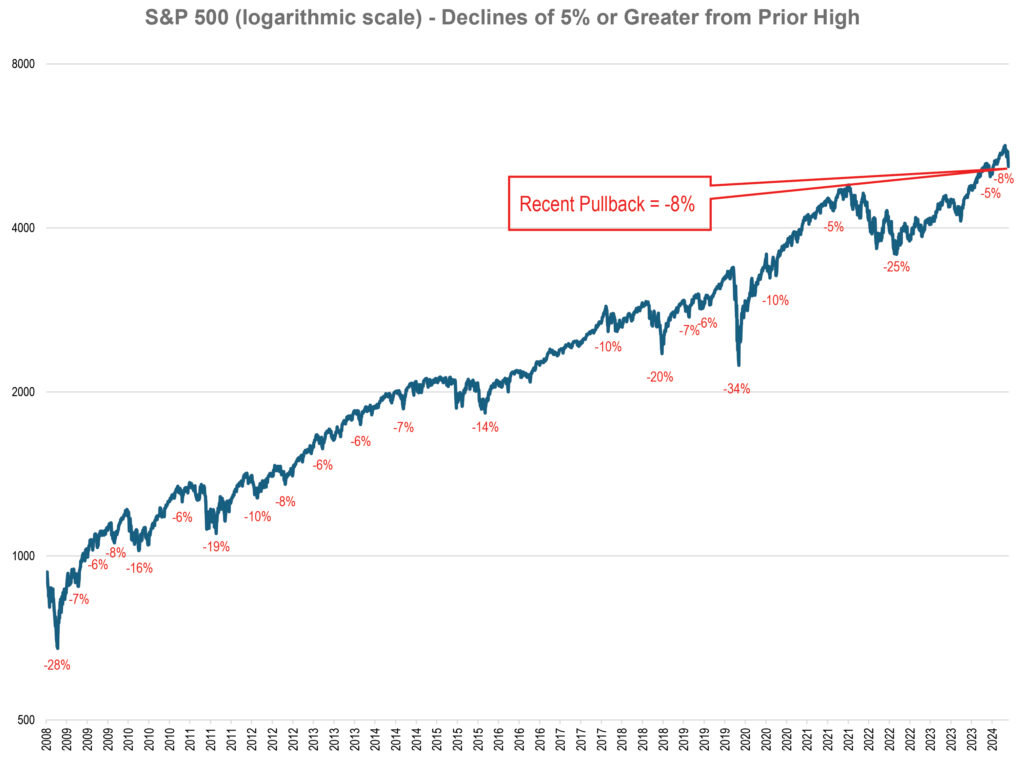
Despite strong second quarter earnings, investors may have been looking for a reason for the market to cool off, which is normal stock market behavior. If you zoom out over the long term, whenever the market hits a new high, a 5% or more pullback is likely. Historically, these pullbacks have been healthy and vital in preventing bull markets from morphing into overextended bubbles that inevitably crash. While the carry trade and jobs report sparked the selling, investors may just have been waiting for a reason to let the air out of the market after a strong run.
Figure 4. S&P 500 – Pullbacks of 5% or Greater Following New Highs

The Verdict – A normal market reaction to overbought conditions.
Market volatility can be scary, and no one likes to watch declines in their portfolios. Yet when market narratives change so dramatically in the matter of days, it is prudent to calmly assess whether the fear is warranted or an overreaction. We won’t know until early September whether the July jobs data was a one-off weak month or the beginning of a larger trend. But we do know that the US economy continues to grow, likely at around 2.5% in 2024, and the Fed is going to start cutting rates imminently. Furthermore, corporate earnings grew at 11.5% year-over-year in the second quarter and 78% of S&P 500 companies have reported positive EPS surprises thus far. Those conditions suggest that despite the carry-trade volatility and market pullback, the soft-landing window remains open.
Thank you, as always, for the opportunity to serve you.
Read the Forbes article – Here
Vestbridge Advisors, Inc. (“VB”) Is registered with the US Securities and Exchange Commission as a registered investment advisor with principal offices at 3393 Bargaintown Road, Egg Harbor Township, NJ. The information contained in this publication is meant for informational purposes only and does not constitute a direct offer to any individual or entity for the sale of securities or advisory services. Advisory advice is provided to individuals and entities in those states in which VB is authorized to do business. For more detailed information on VB, please visit our website at www.Vestbridge.com and view our Privacy Policy and our ADV2 Disclosure Document that contains relevant information about VB. Although VB is a fairly new organization, any references herein to the experience of the firm and its staff relates to prior experience with affiliated and nonaffiliated entities in similar investment related activities. All statistical information contained herein was believed to be the most current available at the time of the publishing of this publication.
