
Collateral Damage From Fed Policy, Part 2: A Broken Housing Market
March 13, 2024
By Dr. George Calhoun
Vestbridge Advisors, Inc. Advisory Board Member
Executive Director of the Hanlon Financial Systems Center

The Federal Reserve has launched an unorthodox two-pronged program of monetary tightening, which has had a severe impact on the housing market.
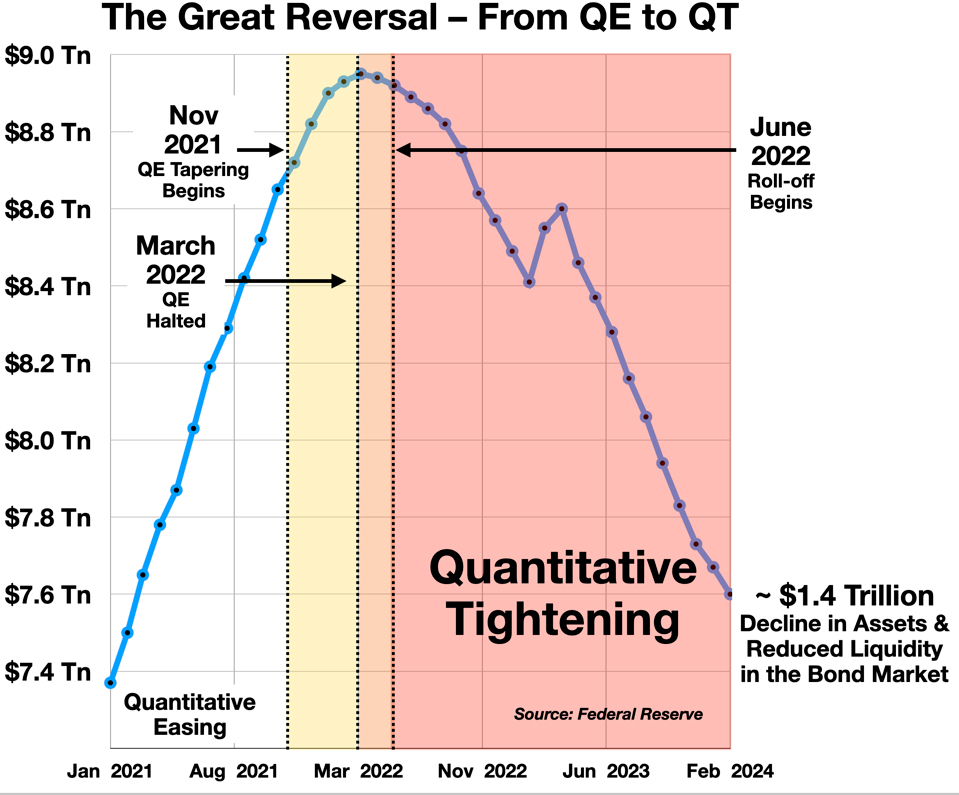
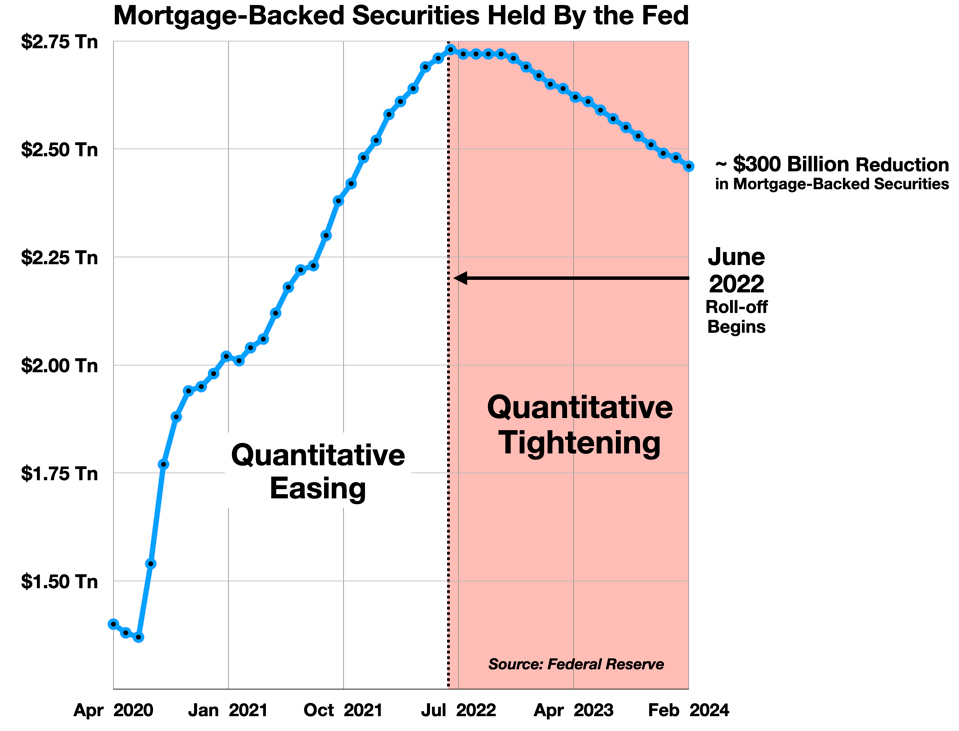
First, in November 2021, the Fed began transitioning from quantitative easing (accumulating government bonds on a vast scale) to quantitative tightening, or QT (slowing, stopping, and then reversing the process, to reduce the Fed’s bond holdings). Since June 2022, this program has cancelled more than $300 Billion of market support for mortgage-backed securities (MBS), a financial pillar of the housing industry. MBS prices have fallen significantly, and yields have soared six-fold.
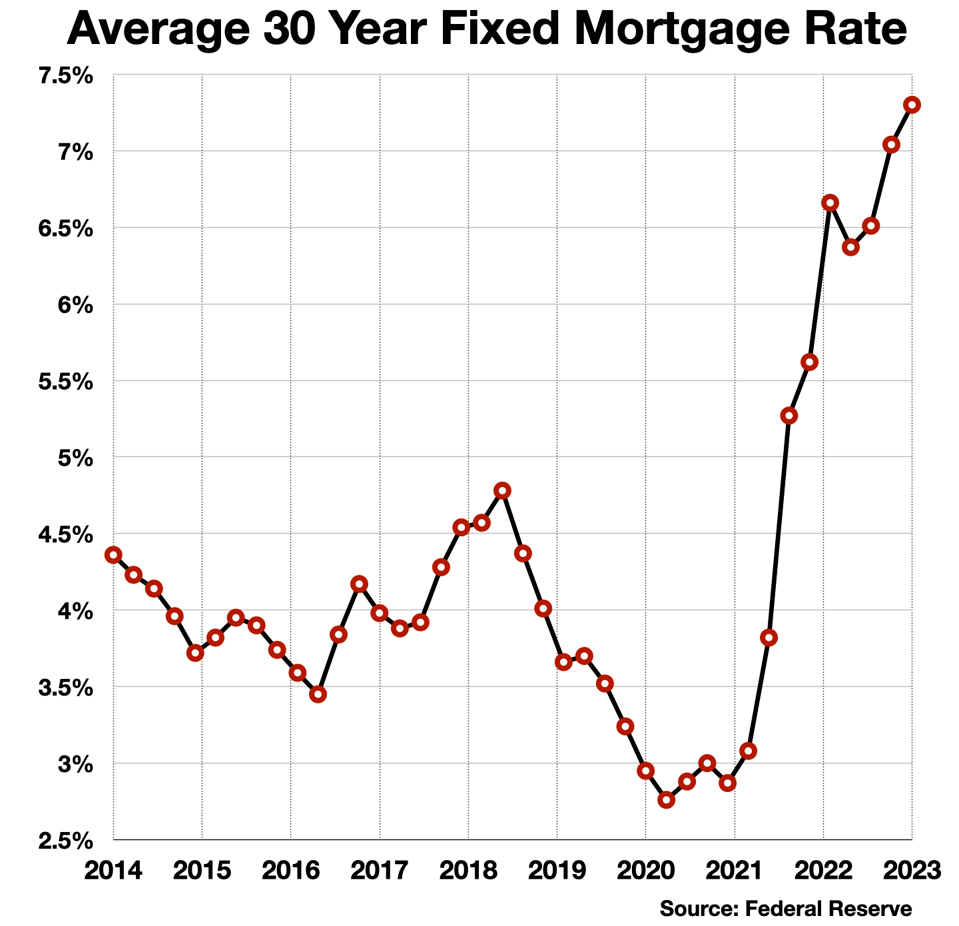
A few months later, the Fed began to hike up interest rates, rapidly and forcefully, which doubled mortgage rates in six months.
The combined effect was a sudden ratcheting up of the costs of borrowing for homeownership — along with serious distortions of the real estate market, which have led to a breakdown in its normal functioning.
The problem is compounded by the fact that these two policies are driven by different objectives, and are only loosely coordinated (as described in my previous column). They interact in ways that have not been well modeled, with consequences that are not yet well understood. But it seems clear that the damage to the housing industry has been more severe than expected.
The Interest Rate Storm
The Federal Reserve began raising interest rates aggressively in March 2022. The Fed raised the Fed Funds target rate 525 basis points in 16 months (higher and faster than at any time in the last 40 years).
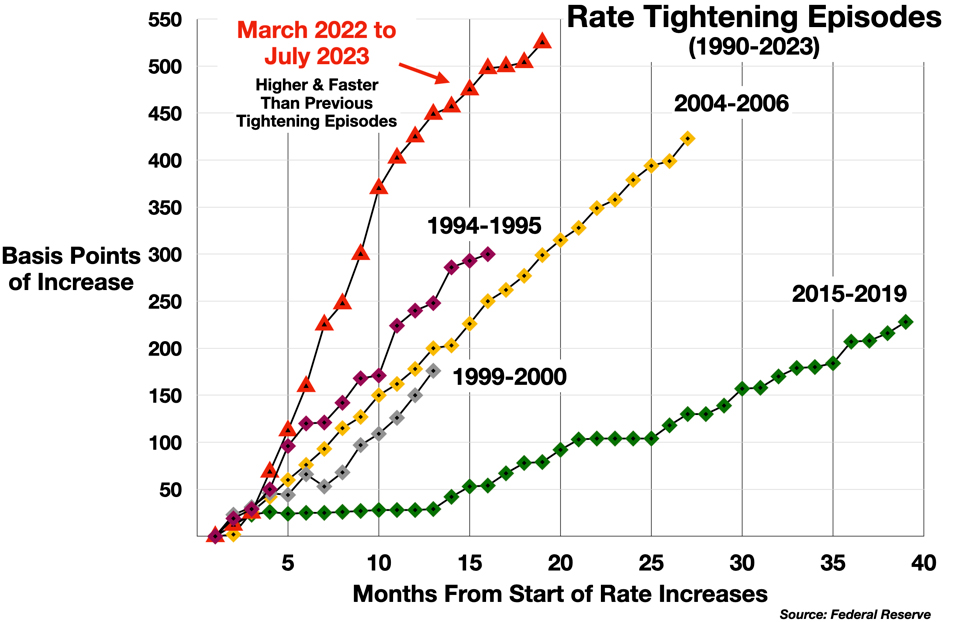
The goal was to “combat inflation.” Whether or not it had any effect on consumer prices, the surge in rates had an immediate impact on the housing market.
There are two ways of looking at this: micro and macro – from the consumer’s perspective, and as it impacts the housing market as a whole.
The Consumer’s Perspective: Higher Costs of Homeownership
Housing costs comprise the largest regular expense for most American families, averaging 20-30% of disposable income – far more than spending on groceries (5.6%), gasoline (2.6%), clothing (2.0%), or healthcare (11%). For homeowners (65.9% of American households), the total cost of the roof overhead includes mortgage payments, home insurance, homeowners association fees, taxes, and utilities (electricity, energy) – and of this, mortgage payments are the largest component.
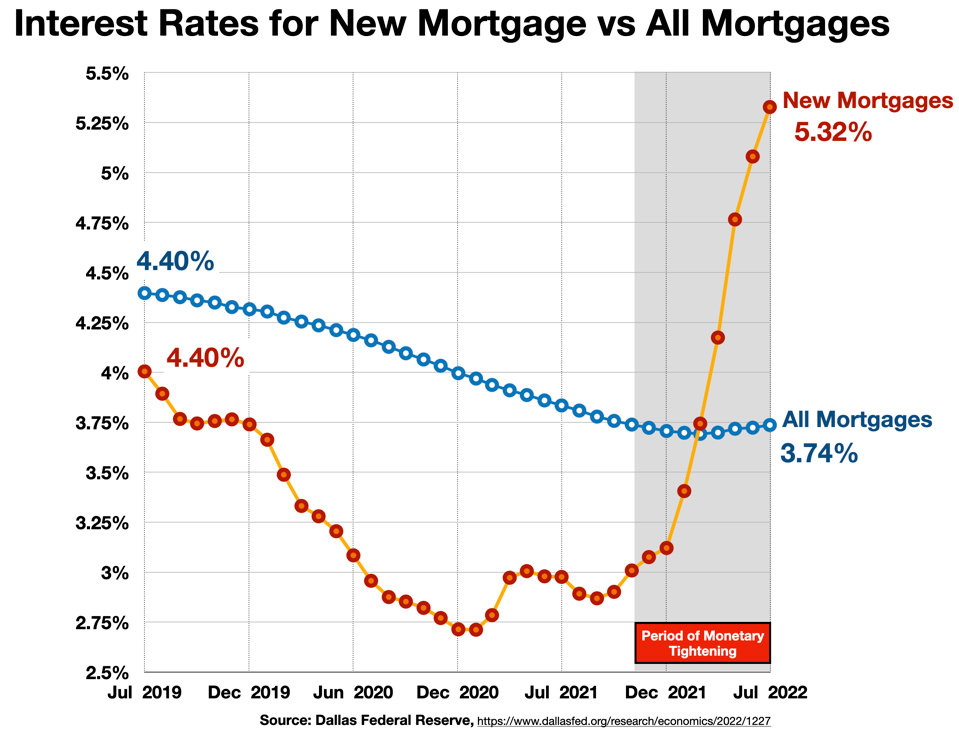
However, 92% of current mortgages carry a fixed rate of interest and are unaffected by the Fed’s engineered interest rate increases (for now). Even many adjustable rate mortgages have delayed reset dates that have not yet kicked in. In fact, according to the Dallas Federal Reserve, while the interest rate on the new mortgages rose, the average interest rate on all outstanding mortgages actually declined from 2019 to 2022.
This might suggest that the impact of the the Fed’s interest rate policy has been moderate, perhaps “acceptable,” even “working as intended.” Still, for new first-time buyers, or the 28 million “movers” who bought new houses last year, or the 8 million or so existing adjustable rate mortgages, the doubling of the current interest rate on new mortgages is a major inflationary penalty (although, oddly, the Consumer Price Index and other inflation indexes do not actually include mortgage payments in their calculations of inflation).
This is a direct outcome of the Fed’s rate increases. Mortgage costs jumped upward in 2021 when the Fed began its campaign.
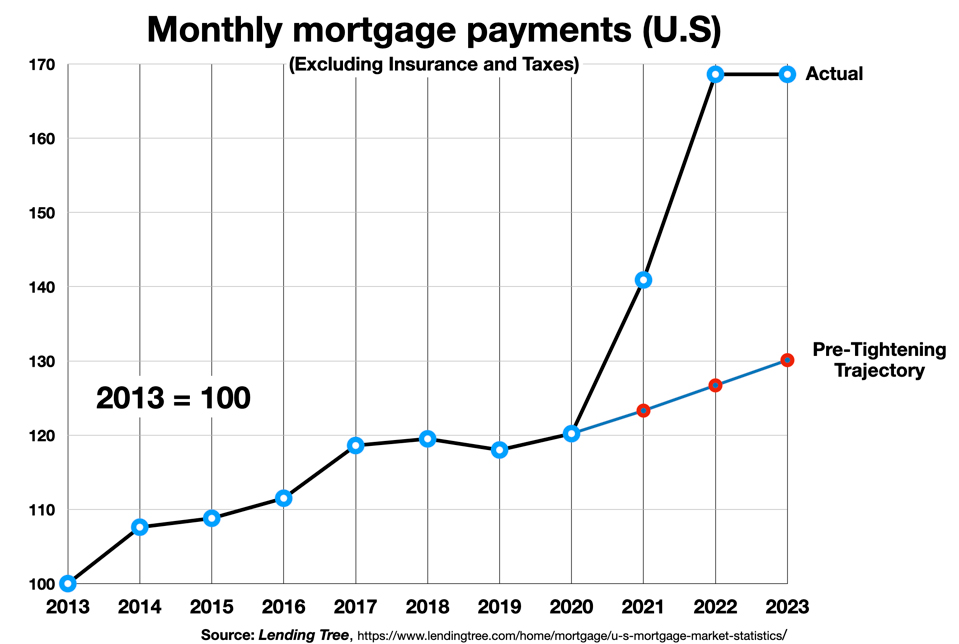
According to Zillow (which arguably has better data on the real estate market than the government does), “the income needed to comfortably afford a home is up 80% since 2020, while median income has risen 23% in that time.”
- “The monthly mortgage payment on a typical U.S. home has nearly doubled since January 2020, up 96.4% to $2,188 (assuming a 10% down payment).”
(For comparison, the average monthly expenditure on gasoline – often perceived as a prominent source of inflation – is about $150-200.)
Even for those who have not yet been directly affected, the perception of problems in the housing market has been increasing, and is creating considerable anxiety. The most recent Financial Times/Michigan Ross poll of consumer economic sentiment found that 13% of respondents cited mortgage costs as the biggest source of personal financial stress in the last month, and 33% cited housing costs as their overall number one economic concern. Moreover, housing costs were the 2nd most cited economic problem (after “inflation”) that people mentioned as likely to determine which presidential candidate they would vote for in November. Whether or not the public understands the specifics of the disruptions described below, there is clearly widespread uneasiness about the state of the housing market.
But this is only part of the picture. The unintended macroeconomic consequences of the Fed’s policies are, well, much more consequential.
The Macroeconomic Perspective: Disruption of a Key Sector of the Economy
Housing is an enormous slice of the economic pie. It directly drives about one-sixth of the spending in the real economy. It looms even larger in the financial economy, where residential real estate supports, and is supported by, a $16 Trillion debt market. Estimates of the total value of residential real estate in the United States range from $47 Trillion to $52 Trillion –- double what it was before the pandemic. The value of the total real estate market in the United States (residential, commercial, and other) will reach “a staggering value of US$119.80 Trillion” this year – four times larger than the U.S. GDP.
This gives a sense of the leverage the Fed wields, and the damage potential if the effects are misjudged. Adding hundreds of basis points to the cost of credit, in a compressed time frame, applied to a debt market of this size, and referenced to an even larger asset base, would — if spread across the entire market – add hundreds of billions of dollars annually in interest expense for borrowers. It would force a devaluation of the existing bonds and other debt instruments the same order of magnitude, which would in turn create large losses due to mark-to-market accounting (which will be explored in the next column).
There is also a powerful indirect effect of a disordered housing market on the broader economy, as the Congressional Research Service summarized last year:
- “Fluctuations in the housing market, particularly housing prices, can have broader effects on the economy through so-called wealth effects. An increase in housing value encourages homeowners to spend more than they do at other times for a variety of reasons, including higher confidence in the economy, increased home equity for homeowners to borrow against, and higher rental income. A decrease in prices results in the opposite. In the United States, consumer spending makes up roughly 70% of the economy; therefore, changes in housing wealth can result in significant changes in economic growth.”
In summary, doubling the cost of new credit for this enormous market, in a very short period of time, must have an outsized impact on asset values, on supply and demand for houses, and on public psychology.
The Compounding Effect of Quantitative Tightening
Quantitative Tightening is not focused on controlling inflation per se. In simplest terms, it is the opposite of QE — instead of buying bonds to support the bond market, QT involves selling or not replacing maturing government bonds, and so shrinking the Fed’s balance sheet and reducing the liquidity in the bond market.
QT is seen to be riskier than manipulating interest rates. While adjusting the Federal Funds rate is a policy instrument that the Central Bank has used for decades, QT has never truly been tested at scale, until now. In 2018 and 2019, the Federal Reserve cycled through a modest experiment with QT. It quickly ran in to unexpected trouble, and had to be suspended. The Fed was forced to restart the QE program.
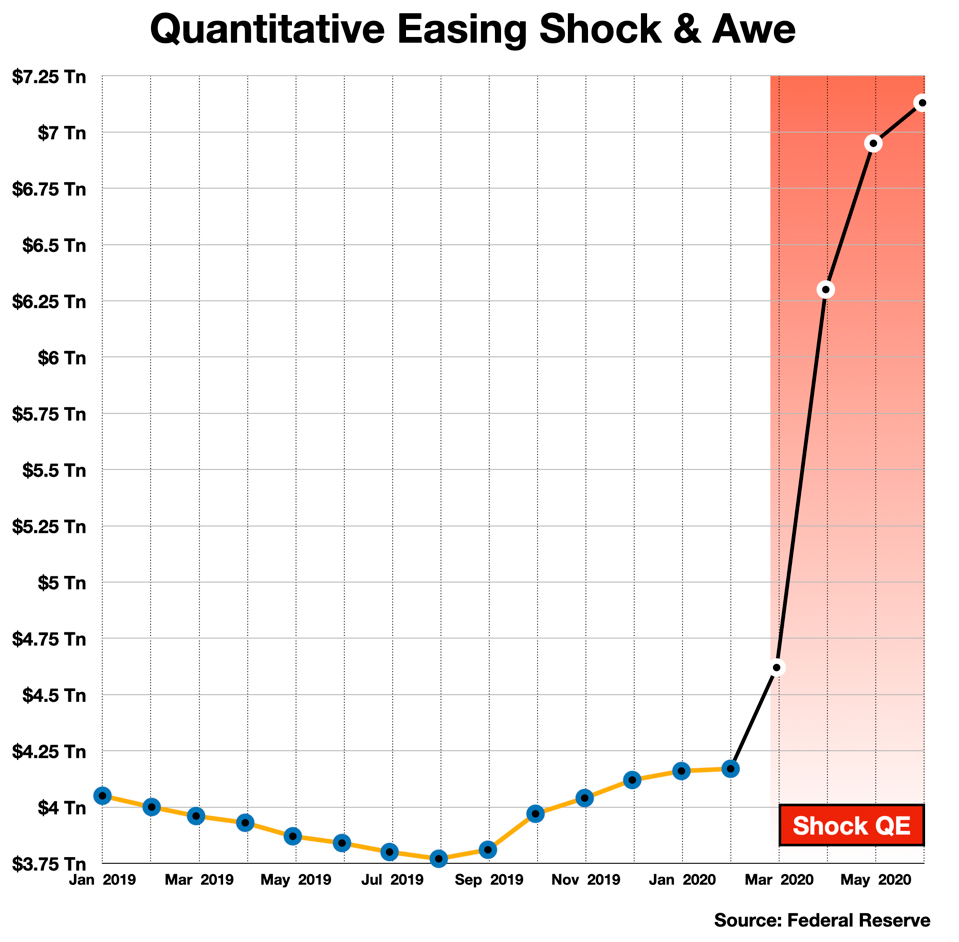
When the Covid-19 pandemic hit, Quantitative Easing went into hyperdrive. The Fed applied “shock and awe” buying nearly $3 trillion of bonds in less than 3 months, and continued to buy an average of $100 Billion of net new bonds per month for the next two years, reaching a heretofore inconceivable total of almost $9 Trillion of bonds held on its balance sheet by May 2022. This made the eventual shift to QT both more important, and more challenging.
In June 2022, the Fed finally threw the gearshift into reverse, withdrawing from the buy-side of the market and allowing maturing bonds to “roll off” without replacement. Bond holdings were reduced by $1.4 Tn in the next 2 years.
The MBS Component
Most of the bonds purchased during the QE phase, and now rolling off without replacement in the QT phase, are Treasury bonds. But about $1.3 Trillion of the Fed’s purchases from April 2020 to April 2022 were mortgage-backed securities (MBS) issued by Fannie Mae, Freddie Mac, and Ginnie Mae, propping up the housing market. About $300 Billion worth of those mortgage-based securities have so far been allowed to mature without replacement.
The direct result was a sudden and significant drop in MBS values, and an even more dramatic rise in MBS yields. These changes were closely synchronized with the onset of QT.
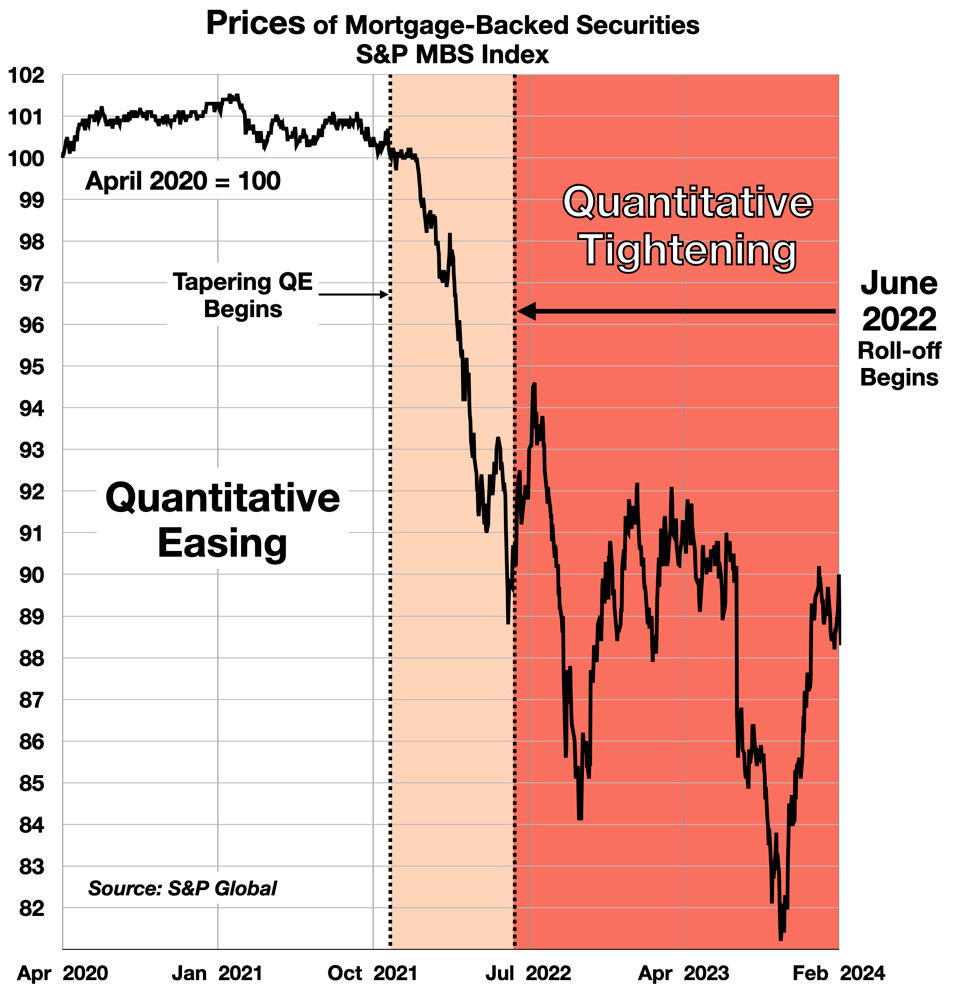
Of course, as prices fell, yields soared. From 1% to 1.5% in 2020-2021, MBS yields reached 6% in late 2023.
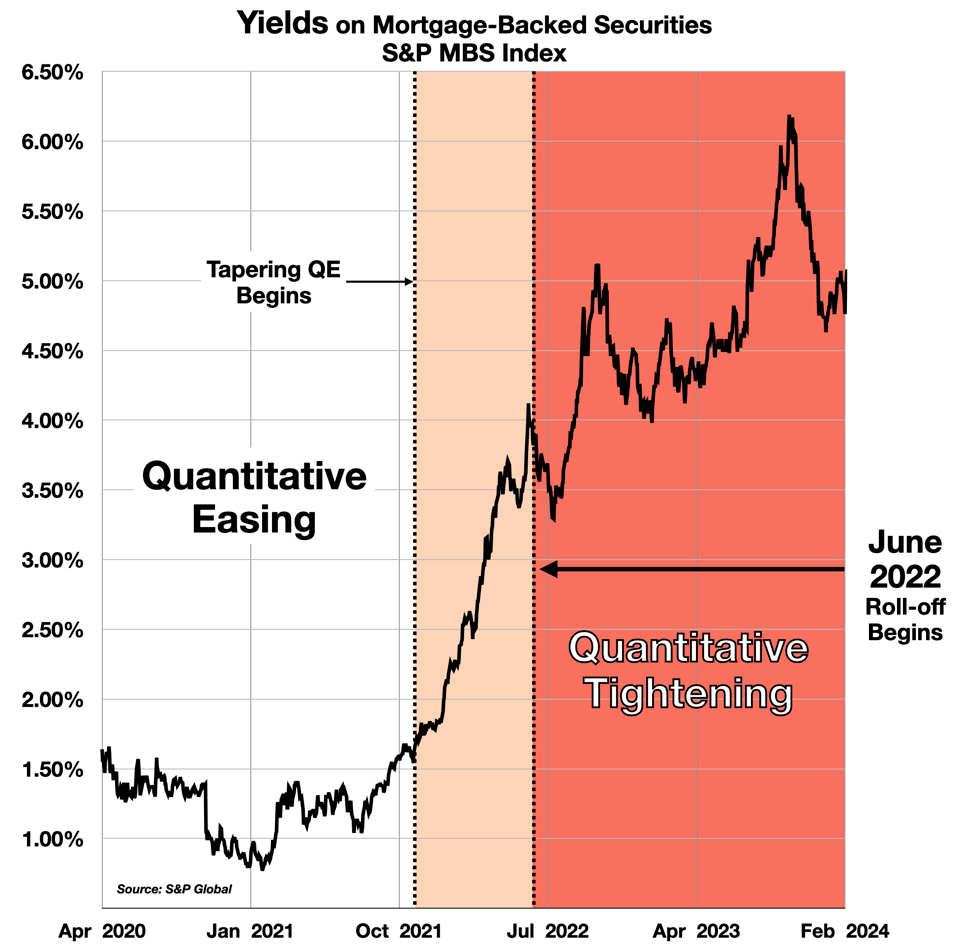
The Fed’s push into the MBS market in the QE phase had been large enough to raise concerns about the effects of unwinding that position. In mid-2022, Goldman Sachs noted that the Fed had accumulated fully 1/3rd of the total MBS universe – and almost 40% of the most attractive segments. Reversing the process to exit from such an enormous position inevitably introduced a high level of uncertainty about the direct and indirect effects on markets where for a decade the Fed had been – and now no longer would be – the single most dominant market participant. The steep drop in prices and even steeper rise in yields were the consequence of this withdrawal of support.
Many observers were (and are still) quite worried. BNY Mellon foresaw difficulties from the beginning – “we expect mortgage-backed securities (MBS) to come under further direct pressure from QT.” Others focused on the upside. Goldman Sachs saw “market dislocation and disruption” which, perhaps typically for Goldman, they identified as “attractive investment opportunities” to be successfully “navigated.”
The Distortions in the Housing Market
- “The biggest issue with the housing market is that there aren’t enough houses. The shelves are bare. There’s a huge imbalance of buyers vs. sellers.”– Dan Green, the CEO of Homebuyer.com, in Fortune
Ructions in the financial markets arising from the Fed’s roughshod policies are mainly a concern for professionals. The general public is far more affected by the damage to the real economy – in this case, the multi-trillion dollar housing sector.
Aside from the obvious increase in mortgage rates, what are the effects of these two semi-coordinated, differently-targeted programs on the huge residential real estate industry?
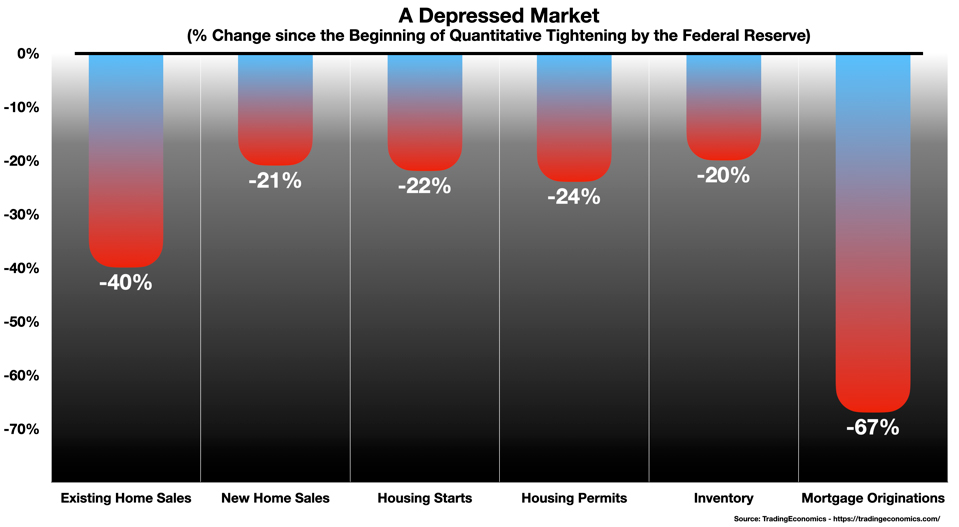
Demand
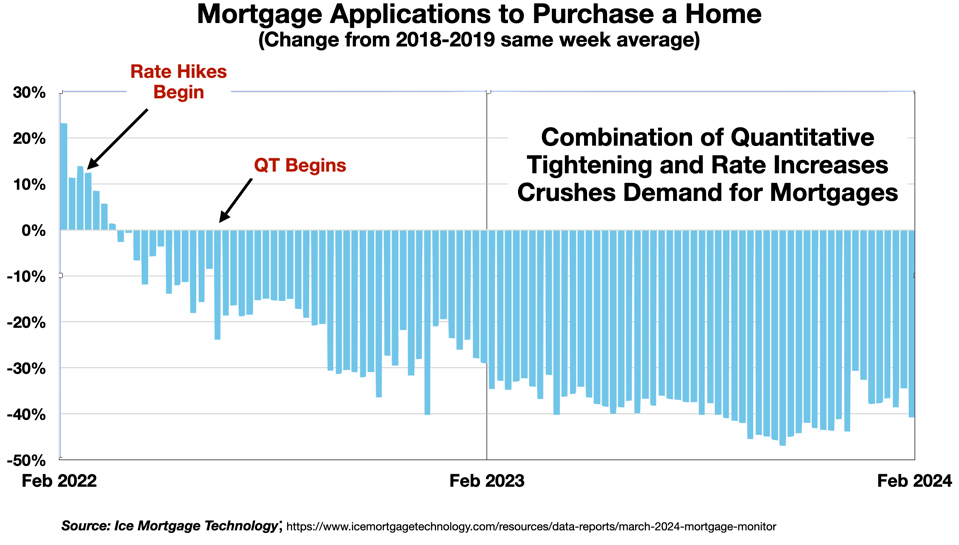
Predictably, higher rates drove down demand for housing, as measured by the volume of mortgages. Mortgage applications and originations fell last year to the lowest level in decades.
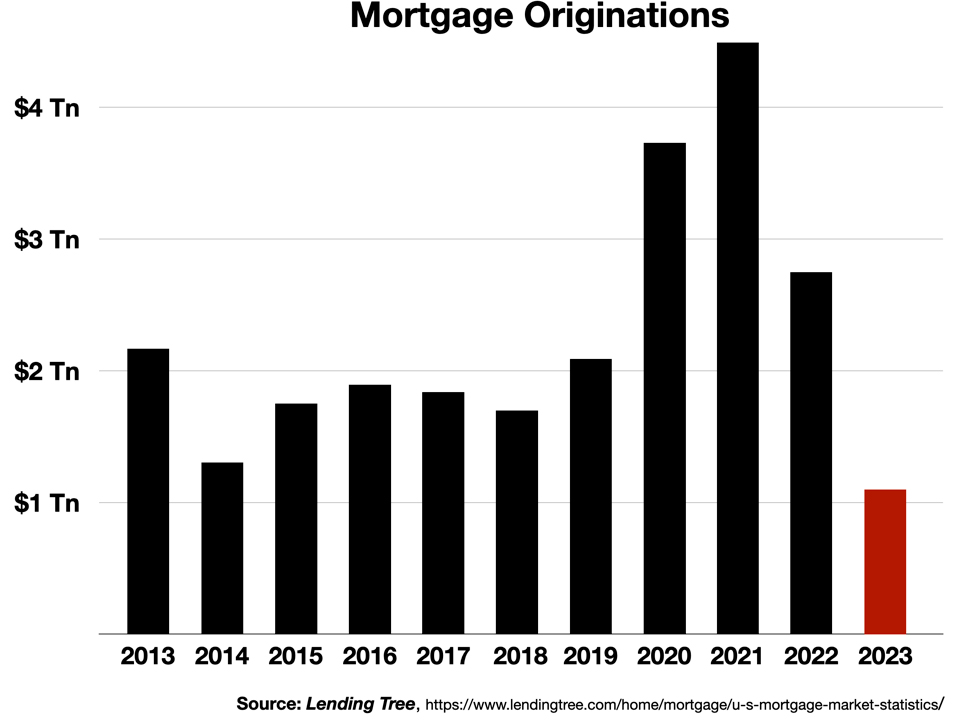
Again QT functioned as an accelerant, driving down demand for mortgages even further.
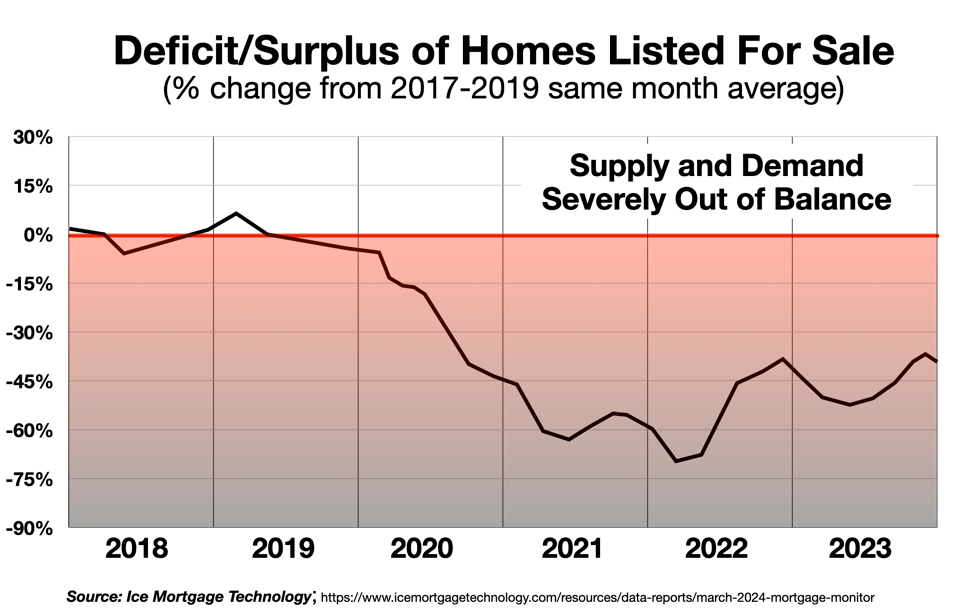
Supply
Higher rates strangled the supply side of the market. Listings dropped as “movers” who might have wanted to purchase houses held off, discouraged by the prospect of exchanging a low fixed rate mortgage for a new much higher rate.
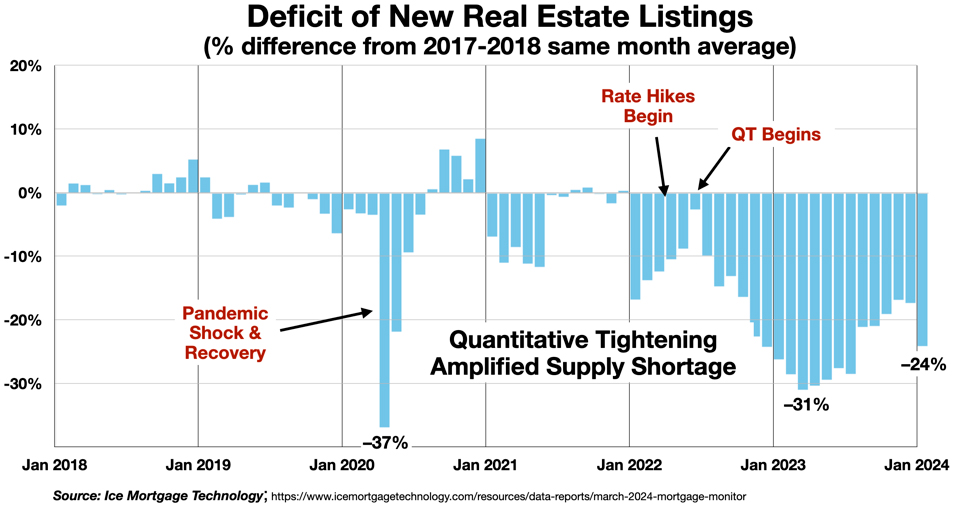
The effect of the Fed’s rate increases was small initially, and showed signs of renormalizing – until the start of QT, which crushed the market. Inventories declined, and the market remains deeply imbalanced.
Prices
The deep decline in supply (which should tend to push prices up) was more than offset by the reduction in demand, and home prices fell on a quarterly basis last year.
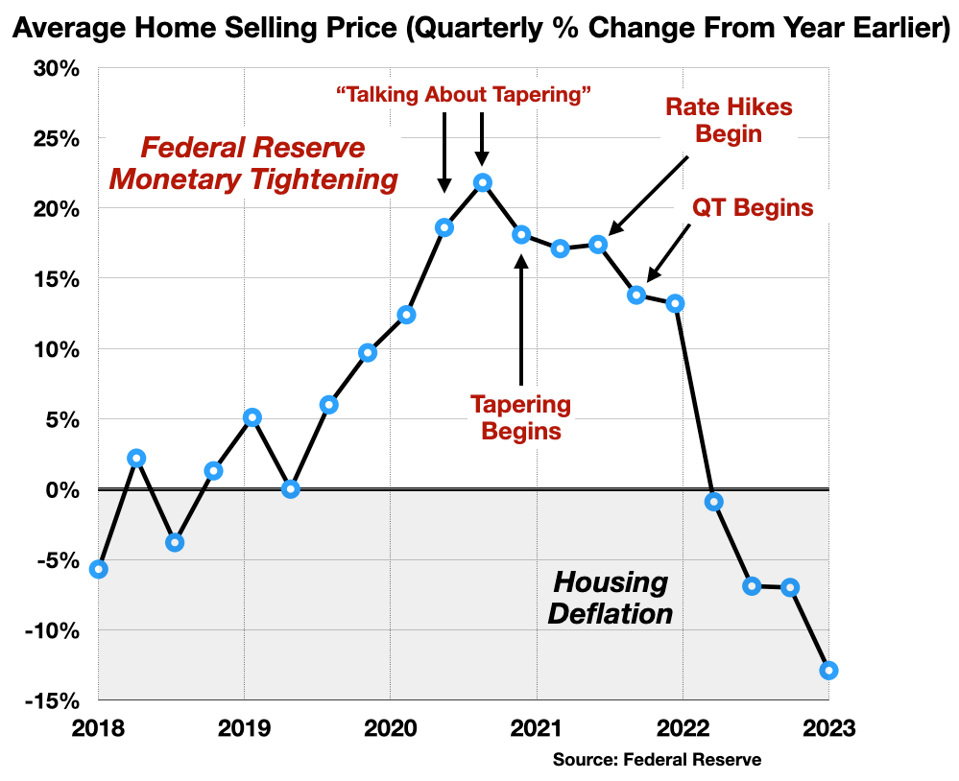
Prices in some areas seem to be holding up, but the effect may be artificial. The market is depressed, performing at levels far below the trend line.
Unequal Impact
- “Elevated mortgage rates, out-of-reach home prices and record-low housing stock continue to make for a perfect unaffordability recipe.” – Forbes
“Unaffordability,” along with the deep decline in mortgage originations, points to another way in which the housing market is distorted: the effects fall unequally on the less well-off.
Mortgage-based purchases have fallen much more than total transactions. All-cash buyers are still able to do deals, which obviously skew towards the wealthy. For example, in the peculiar microcosm that is Manhattan, the Financial Times reported this month that “the record number of cash offers show New York property is only for the rich” –
- “More than two-thirds of home sales in Manhattan last quarter were cash purchases, a record, as high rates on mortgages deter all but the richest buyers. As mortgage rates hover around 6 per cent, nearly 70 per cent of Manhattan homes purchased in the final quarter of 2023 were bought without a mortgage. High mortgage rates are creating a real void for people who don’t have the strong finances that are required to buy in cash.” – (March 5, 2024)
Housing is the main asset and store of value for most Americans. Reduced liquidity, impaired financeability, and overall unaffordability, along with the general uncertainty in this sector and the growing sense of inequity, carry a psychological and socio-economic weight greater than the scale of the fluctuations would suggest. The Michigan survey suggest that the housing market distress may also have political implications.
QT Is A ‘Force Multiplier’ For The Rate Hikes
Raising the Federal Funds Rate drives up the yields on Treasury bonds and the interest rates on home mortgages. The simultaneous pursuit of QT has amped up the cost of mortgages beyond what the Fed may have modeled as the outcome of its rate hike program. The Wall Street Journal writes:
- “In the ‘quantitative tightening’ program that the Fed kicked off last year, it is currently allowing up to $60 billion in Treasurys and $35 billion in mortgage-backed and agency securities to mature each month without replacing them, effectively adding to the supply of bonds that other buyers must absorb. That in turn puts downward pressure on securities prices and upward pressure on rates.”
- “The Fed, however, could be underestimating what its commitment to quantitative tightening is doing to market psychology. This is particularly the case with mortgages: Not only is the Fed reducing its holdings, but big banks, focused on overcoming the effects of rising interest rates, have been less eager to buy. Mortgage rates are much higher relative to Treasury yields than has historically been the case, magnifying stresses on the housing market.”
Just how much is the QT adding to the problem?
From 2000-2019, the relationship between Treasury bond market and the Mortgage market was fairly stable, with an average spread of about 170 basis points (bps). The pandemic shock produced a sudden spike, but the markets soon renormalized and the spread sat at 134 bps in May 2021.
That month Fed officials began to suggest that it was time to start “talking about tapering” – that is, they started telegraphing the shift to reducing the Fed’s balance sheet – quantitative tightening. After QT officially began in June 2022, the spread between the mortgage rate and the Treasury market more than doubled – and remains elevated far above pre-QT levels.
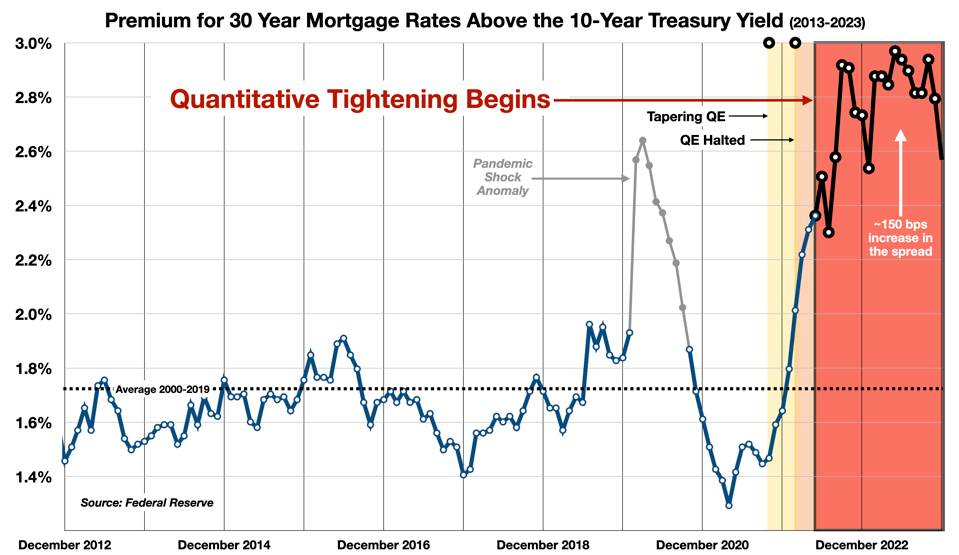
A close-up shows how the widening of this spread was triggered and sustained by the policy shift to QT.
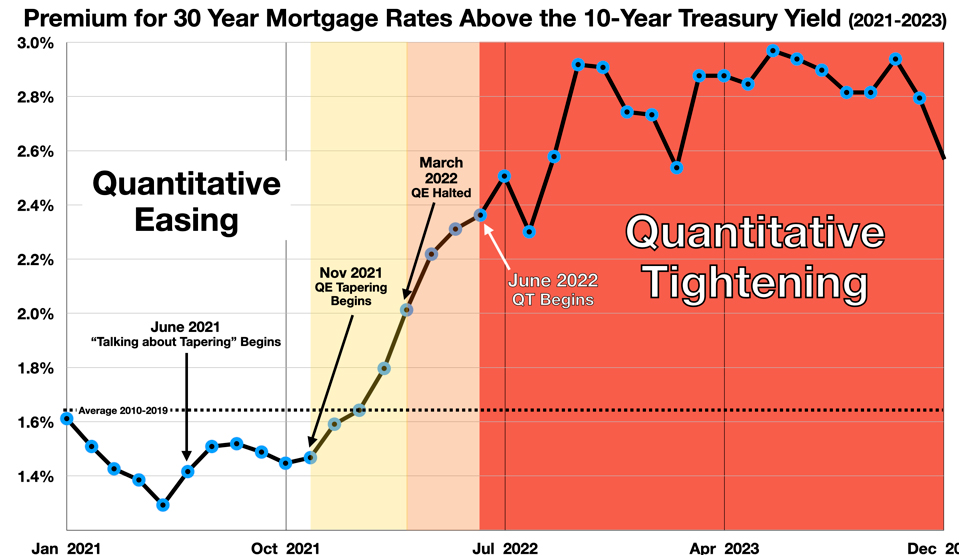
This suggests that QT has added 1½ percentage points to mortgage rates, over and above the effect of the Fed’s official rate increase program. That would equate to about $300 extra interest charges per month on the average mortgage debt (~$245,000).
The Housing Market is Out Of Joint
It is widely recognized that the housing market is in structural distress. Fortune magazine tells us that the U.S. is in “housing winter” and “it’s going to take 3 or 4 years to unfreeze the housing market.”
- “In late October 2023, existing-home sales plummeted to the lowest level since 2010, when the world economy, and particularly the U.S. housing market, were struggling to pull out of the Great Financial Crisis. This signaled a frozen housing market, in which fewer homes were changing hands because of sky-high home prices and mortgage rates that peaked at 8%.”
The bottom line: QT appears to have added a significant extra charge to the cost of a new mortgage. It has damaged the market for mortgage-backed securities on which the industry relies for liquidity. Translated into dollars and cents, this means that consumers are paying hundreds of billions more for homeownership than they might have otherwise, and holders of MBS have suffered a similar penalty in the value of their bonds. This huge two-sided “QT surtax” may persist for some time to come.
Follow me on Twitter or LinkedIn.
About the Author:
Dr. George Calhoun, a graduate of the University of Pennsylvania, received his Doctorate Degree from the Wharton School of Business. He has served in multiple capacities in the Financial Sector and in the Wireless Communication Industry. He has authored multiple articles on subjects of interest to him and several books. His most recent book “Price & Value: A Guide to Equity Market Valuation Metrics” is available through the Publisher Springer/Aspress. Dr. Calhoun currently serves as the Executive Director of the Hanlon Financial Systems Research Center at the Stevens Institute of Technology and is an Advisory Board Member of Vestbridge Advisors, Inc.
Vestbridge Advisors, Inc. (“VB”) Is registered with the US Securities and Exchange Commission as a registered investment advisor with principal offices at 3393 Bargaintown Road, Egg Harbor Township, NJ. The information contained in this publication is meant for informational purposes only and does not constitute a direct offer to any individual or entity for the sale of securities or advisory services. Advisory advice is provided to individuals and entities in those states in which VB is authorized to do business. For more detailed information on VB, please visit our website at www.Vestbridge.com and view our Privacy Policy and our ADV2 Disclosure Document that contains relevant information about VB. Although VB is a fairly new organization, any references herein to the experience of the firm and its staff relates to prior experience with affiliated and nonaffiliated entities in similar investment related activities. All statistical information contained herein was believed to be the most current available at the time of the publishing of this publication.