
2024 1st Quarter Review
April 5, 2024
Economic Commentary
Financial markets have gotten off to a hot start to 2024, thanks to optimism that the Federal Reserve will begin cutting interest rates sometime in the second half of the year. Surprisingly, the market’s consensus expectation for rate cuts has moderated to fall in line with the Fed’s projections without causing a selloff in equity markets. At the beginning of the year, the consensus Fed forecast called for three rate cuts (equaling 75 basis points) while Fed Funds futures markets implied double that amount. Fed Funds futures markets now also project 75 basis points of cuts, leaving only the timing of the first rate cut up for debate.
While the Fed does not show projections for timing in its “Dot Plot” summary of interest rate projections, the median forecast for 2024 rates has coalesced around 4.5-4.75%. This was a relief to investors after January and February inflation data has come in a bit hotter than the prior months’ data. The Fed acknowledged the setback but also cautioned that there would be bumps along the way to 2% inflation and noted that there may have been seasonal trends at play as the new year commenced.
Exhibit 1. Fed “Dot Plot” Changes from December 2023 to March 2024
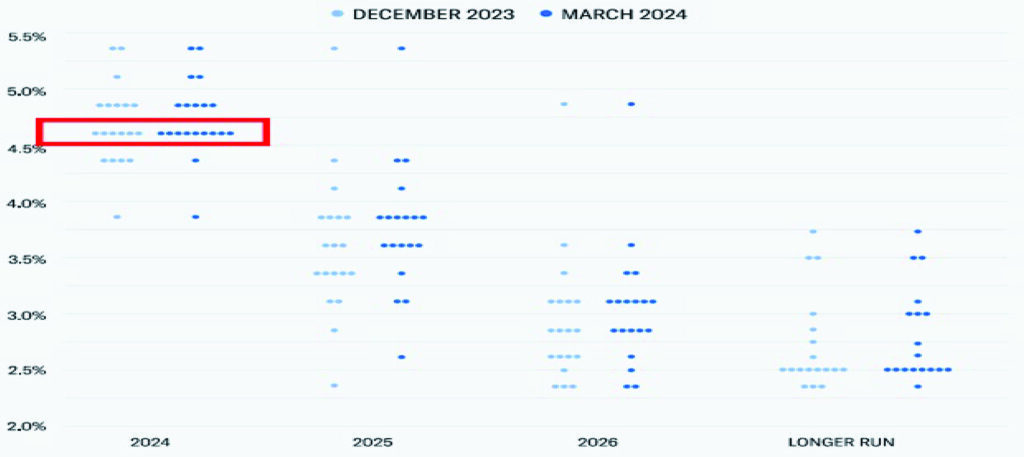
The Fed has been content to bide its time in cutting rates thanks to the resiliency of the US jobs market and economic productivity as reflected in GDP data. The unemployment rate ticked up slightly in February but remains low at 3.9%. GDP data in the fourth quarter of 2023 continued to defy economists’ expectations, clocking in at 3.4%. Considering that nearly all major banks and economic forecasts called for a mild 2023 recession, the performance of the US economy has been nothing short of remarkable.
While we appear to be on target to attain the elusive “soft landing”, there are still obstacles that must be overcome before the Fed can confidently bring rates down without reigniting inflation. The Fed has thus far been unable to solve the Shelter inflation conundrum. Year-over-year, the Consumer Price Index Shelter component is up 5.7% as of February 2024. The cost of the average 30-year fixed rate mortgage has risen to over 7%, but the lack of housing inventory has kept consistent upwards pressure on home prices in most US regions. High mortgage rates may be deterring some buyers from bidding up prices, but they are also keeping potential sellers on the sidelines which limits available housing stock. Few homeowners who locked in mortgages under 4% are willing to trade in their favorable rate, and 60% of US homeowners fall in that 4%-or-less category. It is difficult to determine whether Fed rate cuts will bring enough existing homes on the market to alleviate the inflation caused by limited inventory, or if the lower rates will trigger bidding wars that drive up housing inflation further. Given the opposing forces of high rates and low inventory, it seems the Fed’s influence is limited regarding controlling Shelter inflation.
Most other segments of inflation are cooling, although there remain pockets of concern such as Transportation Services, the cost of which is up 9.9% annually. If the hotter inflation from January-February does not reverse by April, it is possible that enough Fed members modify their rate cut expectations to bring the consensus down to just two cuts, which would undoubtedly disappoint investors. The Cleveland Fed’s Inflation Nowcasting model does not suggest we will backslide, but it is prudent to be aware of the potential risk.
Market Commentary
The S&P 500 has gained 10.5% to begin the year, bolstered not by inflation data but by stellar corporate earnings. Per FactSet data, Earnings-Per-Share (EPS) growth for the S&P 500 was 3.4%, the third straight quarter of year-over-year earnings growth for the index. From a valuation perspective, the S&P 500 is trading at 20.9 times forward 12-month earnings, which is above the five-year average of 19.0. Investors have been eager to maintain or even add exposure, however, thanks to the technological revolution in artificial intelligence (“AI”). Demand for AI-related investment has resulted in jaw-dropping profits for chipmakers but also provides promise to increase efficiency and profitability in a wide range of industries.
Among economic sectors in the S&P 500, the gains have been dispersed beyond just the Technology sector, with Communication Services posting a strong quarterly return at 12.7%. Energy has performed well as oil prices rebounded amidst geopolitical turmoil and OPEC production cuts, up 13.5%. Financial stocks have shrugged off concerns over distressed commercial real estate holdings at banks, surging 12.4% to begin the year. Real Estate is the only sector in the red for the quarter, at -0.7%.
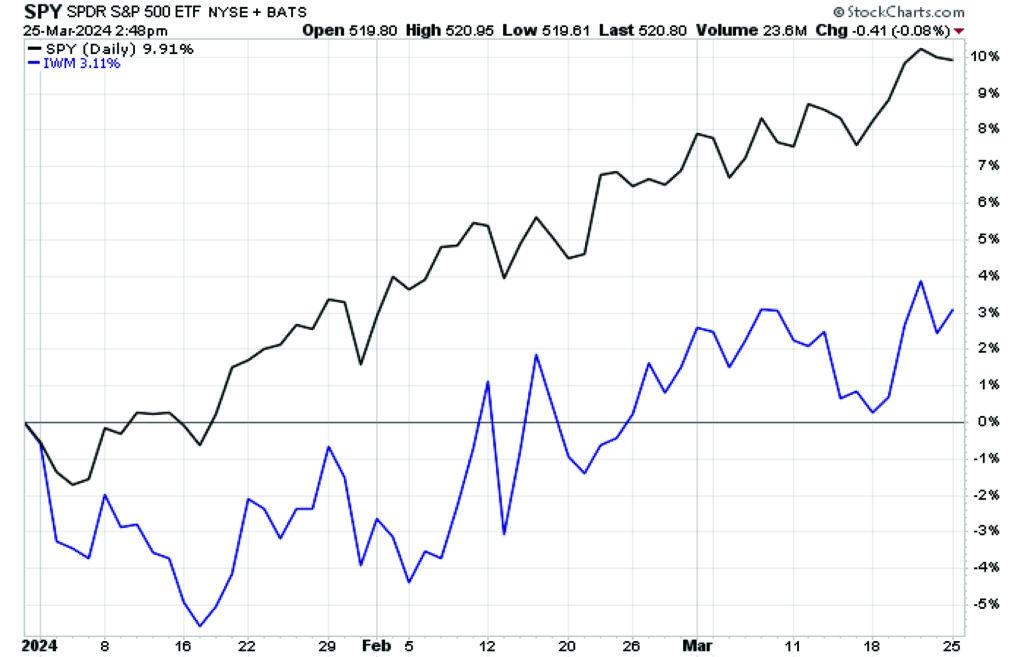
While the gains in the S&P 500 have been spread amongst the various sectors, investors haven’t demonstrated much appetite in 2024 to extend exposure beyond Large Cap companies. Following an impressive surge to close out 2023, Small Cap stocks retreated in 2024 and have only recently begun to claw back to year-to-date gains, presently up 5.2% for 2024. This makes sense considering that the rotation into Small Caps to close out 2023 was predicated on the notion that the Fed would begin cutting rates by March. With that timeline pushed back, the more interest-rate sensitive Small Cap stocks have lost favor among investors.
Given the likelihood that the Fed will initiate rate cuts in June – markets are currently pricing in 65% odds of this timeline – Small Caps remain attractive. As we have noted in the past, the valuations of Small Caps are historically cheap, trading around 14 times forward earnings. We anticipate a swift rotation into small caps leading up to the first rate cut and believe it wise to maintain or add exposure prior to the actual Fed meeting event, be it in June or sometime later in 2024.
Figure 2. Large Cap (SPY) vs Small Cap (IWM) YTD
Outside the US, investors in Developed International Markets are also waiting for a rate cut catalyst to spur equity markets, with three rate cuts in the second half of 2023 expected from the European Central Bank (ECB). It is possible that the ECB may act before the Fed initiates rate cuts, largely because the strength of the US economy has kept upward pressure on wages to a greater extent than the Eurozone has experienced. It’s also worth noting that, unlike the US Fed which seeks to balance price stability and employment (the “dual mandate”), the ECB mandate is solely focused on inflation.
Developed International Markets also include Japan, which is the largest country exposure at just under 24% of the MSCI EAFE Index. Japanese inflation peaked at just above 4%, higher than the Bank of Japan’s (BOJ) 2% target but around half of the peak inflation in the US. The BOJ only recently abandoned eight years of negative interest rates, bringing its benchmark policy rate to 0-0.1%. Japan’s favorable inflation backdrop, along with pro-business reforms, have propelled Japanese stocks to a 11.2% year-to-date performance and been the main driver of EAFE’s 6.0% first quarter returns.
For Emerging Market (EM) investors, the frustration continues as China’s uncertain path and increasing isolation from global markets has made the risk-reward tradeoff of EM investment considerably less attractive. The iShares MSCI Emerging Market ETF (EEM) is up just 2.2% year-to-date and the iShares MSCI China ETF (MCHI) is in the red so far in 2024 at -2.5%. China has a multitude of issues to contend with, including demographic imbalances and a flailing property sector that could potentially usher in a financial crisis. With the unpredictable nature of the Xi regime in power, businesses are rushing to find alternative suppliers outside of China and we foresee this trend continuing, making EM unattractive for the foreseeable future.
In Fixed Income, rates bottomed out around 3.8% for the 10-Year Treasury and have clawed their way back to 4.25% as the Fed timeline has been pushed back. Our preference for owning the short end of the yield curve has remained in place as the shortest-duration Treasuries remain the highest yielding at around 5.3%. We also remained bullish on High Yield bonds throughout the quarter, on the thesis that the US economic strength outweighed any potential strain from higher interest rate refinancing. High Yield bonds returned 1.5% during the quarter, beating the -0.9% return of Investment Grade bonds and the US Aggregate Bond Index’s -0.8% quarterly return.
Closing Remarks
The March Fed meeting was an important test for financial markets, as it followed somewhat disappointing inflation data and could have potentially derailed the three-rate-cut narrative. Fortunately, the Fed struck an upbeat tone, and we believe that the economic strength of the US economy coupled with an exciting technological climate can carry the market until the first rate cut hits. Furthermore, there is still an opportunity for a broadening out into smaller market cap stocks that we still believe is on the horizon. We remain attuned to the risks and will be agile in reassessing our positioning as new developments arise.
Thank you, as always, for the opportunity to serve you.
Vestbridge Advisors, Inc. (“VB”) Is registered with the US Securities and Exchange Commission as a registered investment advisor with principal offices at 3393 Bargaintown Road, Egg Harbor Township, NJ. The information contained in this publication is meant for informational purposes only and does not constitute a direct offer to any individual or entity for the sale of securities or advisory services. Advisory advice is provided to individuals and entities in those states in which VB is authorized to do business. For more detailed information on VB, please visit our website at www.Vestbridge.com and view our Privacy Policy and our ADV2 Disclosure Document that contains relevant information about VB. Although VB is a fairly new organization, any references herein to the experience of the firm and its staff relates to prior experience with affiliated and nonaffiliated entities in similar investment related activities. All statistical information contained herein was believed to be the most current available at the time of the publishing of this publication.