
Managing Expectations for Volatility
As we near the fourth quarter of 2022, many investors are feeling anxious and uncertain about their portfolios as markets grind continuously lower in a bear market that began in January. The past few years have seen quite a roller coaster ride. We had a sudden, steep decline during the COVID-19 shutdown, the massive stimulus splurge leading to a speculative growth stock bubble, and now we are dealing with the reckoning, what we are calling The Great Adjustment, as the Federal Reserve attempts to unwind decades of stimulative monetary policies.
It’s understandable to feel fear during times when news is overwhelmingly negative and the red market days considerably outnumber green ones. The urge to “do something” is instinctual and many investors are likely questioning their asset allocation approach and wondering if they should change course now before things get worse.
With both stocks and bonds performing poorly in 2022 (read our commentary here), traditional defensive shifts from equities into fixed income are not as viable a solution, although bond yields could be nearing an attractive entry point. Even cash offers only marginal safety, due to the erosion in spending power as inflation remains high. With no real alternative, the best approach for most investors, particularly those still in the accumulation stage, is to do nothing and ride out the volatility. We know why the market is behaving poorly (see our commentary on the Fed here) but we should also take a moment to revisit the concept of volatility, and what it potentially means for portfolio returns. Doing so is a useful exercise for investors to reassess their risk tolerance “pain threshold” and make sure they are properly allocated. More importantly, to make sure they know the historical “normal” volatility (downside to be endured) associated with markets and the long-term returns markets generate.
What is Volatility?
Volatility, in financial terms, is the level of market fluctuation, both up and down. Volatility is measured in several ways, the most common being standard deviation. You will often see standard deviation presented as the measure of risk for a given investment. For example, the S&P 500 Index long-term annual historical return (using data from Morningstar going back to 1936) is 10.7%. The standard deviation is 17.6%, implying that a typical expected one-year return for the S&P 500 should be anywhere from 10.7%, plus or minus 17.6%, equaling a range of -6.9% to 28.3% in any one-year period. Some investors mistakenly may read this and think, “I’m comfortable with a -7% loss now and then if it means I’ll average 10.7% over the long term.” However, from Statistics 101, one standard deviation only covers roughly 68% of outcomes, assuming a normally distributed bell curve (for simplicity we will assume the S&P 500 to be normally distributed, although many would argue this is not the case). Two standard deviations from the mean covers roughly 95% of outcomes, and for the S&P 500 example this means we should expect one-year returns of -24.5% to +45.9%, a much wider range of potential returns. Finally, we know that going out to three standard deviations covers over 99% of potential returns, which in our S&P 500 example means one-year returns of -42.1% to +63.5%.
Below is a histogram of the 85 annual return periods for the S&P 500, going back to 1936, which shows how most returns fall within the -7% to + 28% range, but also shows somewhat common returns just outside these levels and extreme outliers to both the upside and downside.
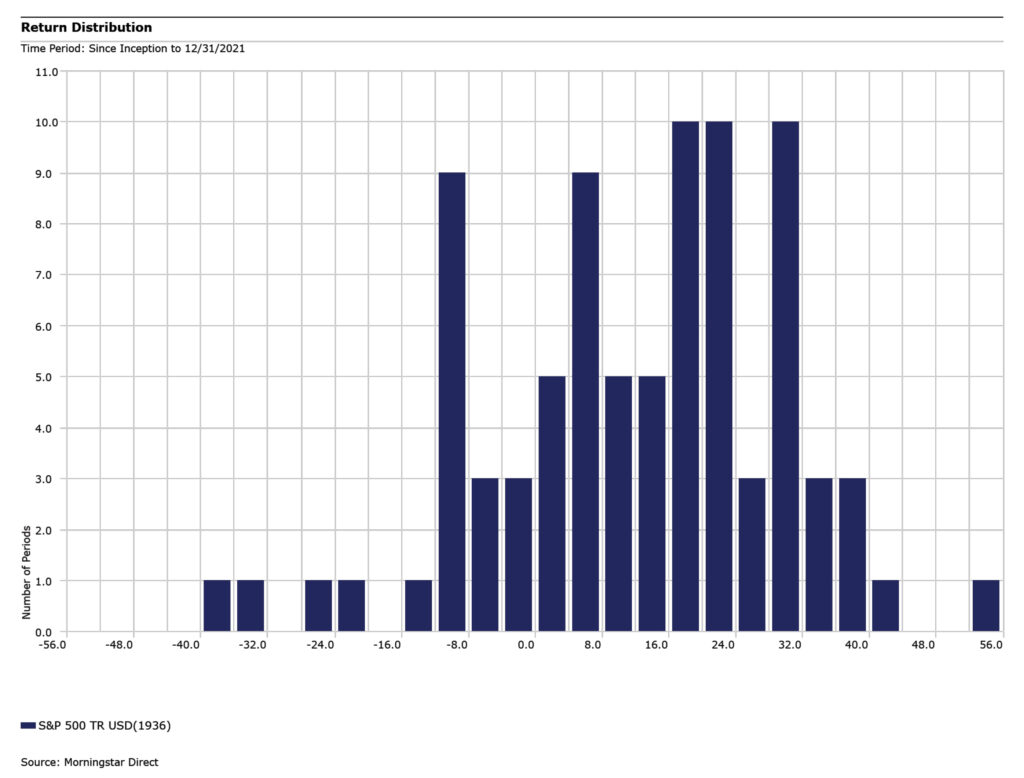
So far this year, after nine months, the S&P 500 is down over -20% year-to-date, so we are looking at one of those outlier years, barring a dramatic fourth quarter turnaround. The losses are real and painful, however behavioral finance tells us that human nature leads us to focus on losses far more than gains. The S&P 500 gained 28.7% in 2021, however the pain of the losses seems much worse than the joy of the gains – this is the experience of nearly all investors, both novice and professional.
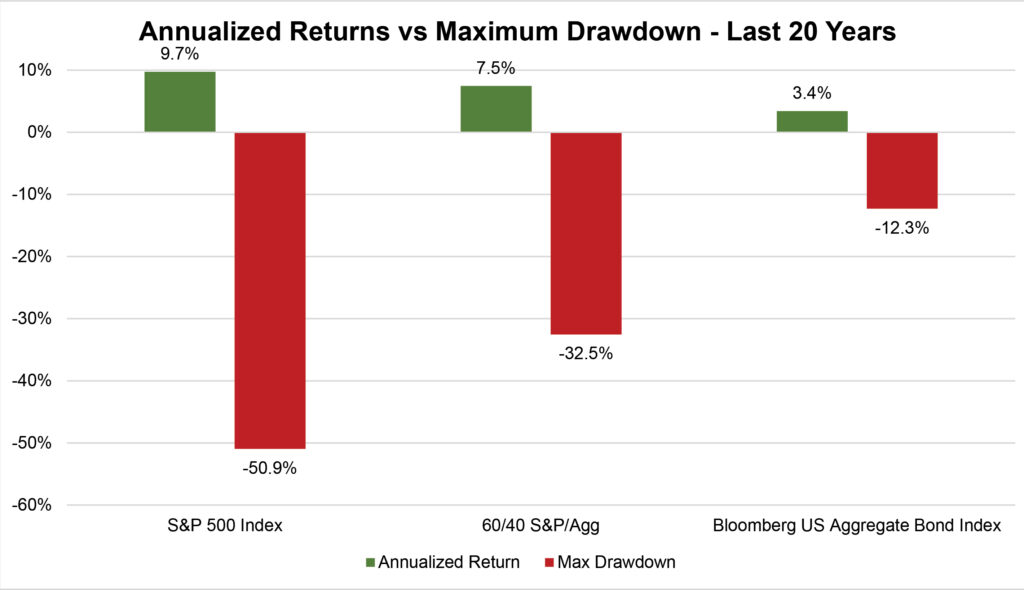
Managing emotions can be challenging but staying disciplined is easier if we understand the risk/reward tradeoff and are honest with our personal threshold for losses. There is a tradeoff that must be endured from time to time, as the below chart demonstrates. Consider 3 typical risk profiles – Aggressive (represented by the S&P 500), Balanced (60/40 S&P 500/US Aggregate Bond Index), and Conservative (US Aggregate Bond Index). An Aggressive investor, to achieve their average return of 9.7%, must accept the potential for a 50.9% decline, but one for the S&P 500 that has always recovered and gone on to reach new, all-time highs, eventually. Even the most Conservative investor, if invested over a long enough timeframe, will inevitably experience a double-digit drawdown in portfolio value. Knowledge and preparation are the keys to sticking to the plan when these drawdowns occur.
We know bear markets are cyclical, and given the Fed’s significant role in engineering this current decline, we know that there is an endgame when inflation is slowed, as it eventually will. That gives us confidence that this too, shall pass. Until then, we can take advantage of the opportunities provided by this bout of volatility to identify mispriced asset classes and make incremental changes, and for taxable client accounts, harvest tax-losses and reposition portfolios for the eventual rebound.
Click here to download a copy of advisory.
Thank you for the opportunity to be of service.