
The 60/40, Down But Not Out
No investment strategy is infinitely infallible and always works. One that typically weathers most economic and market conditions is the 60/40, stock/bond, typically referred to as the classic balanced portfolio. This year it is not working, and this is so out of character. The pain is being felt by investors far and wide and as a professional investment advisor I see and feel your pain and concerns. Below is some historical context about the current market environment. We are certain that in time, these challenging market conditions shall pass.
As mentioned, the 60/40 is considered a “balanced” portfolio, designed to provide more predictable long-term investment returns thanks to the typically uncorrelated performance of the stock and bond components. It is a relatively simple concept; in times where stocks are performing well, capital flows out of lower-returning bonds so the fixed income returns are offset by gains in the stock market. Conversely, when stocks perform poorly, investors pull funds out and allocate to the perceived safety of the bond market. Rather than try to time these swings, a 60/40 participates in a constant mixture of both equities and bonds, thus providing a smoother long-term experience.
As the below chart illustrates, in most years the 60% equity allocation (green bar) has contributed to the bulk of the total returns, however bonds also have typically provided predictable positive returns. The value of the bond component is well illustrated by the three-year period of 1/1/2000-12/31/2002, in which positive fixed income returns offset a significant portion of continuous equity declines. The S&P 500 saw sequential annual losses of -9%, -12% and -22% in those years, yet the 60/40 investor’s annual returns were -1%, -4%, and -10%, approximately. For individuals who needed to draw on their investments during those years, the diversification of the 60/40 proved its worth.
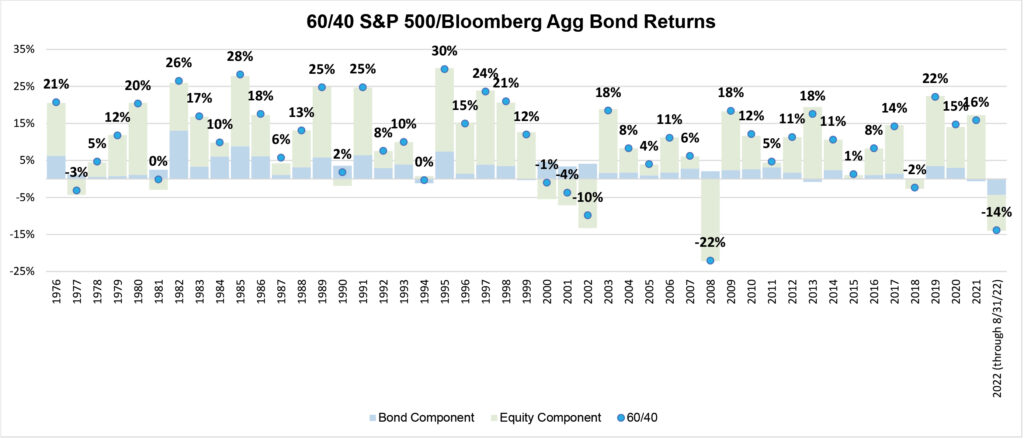
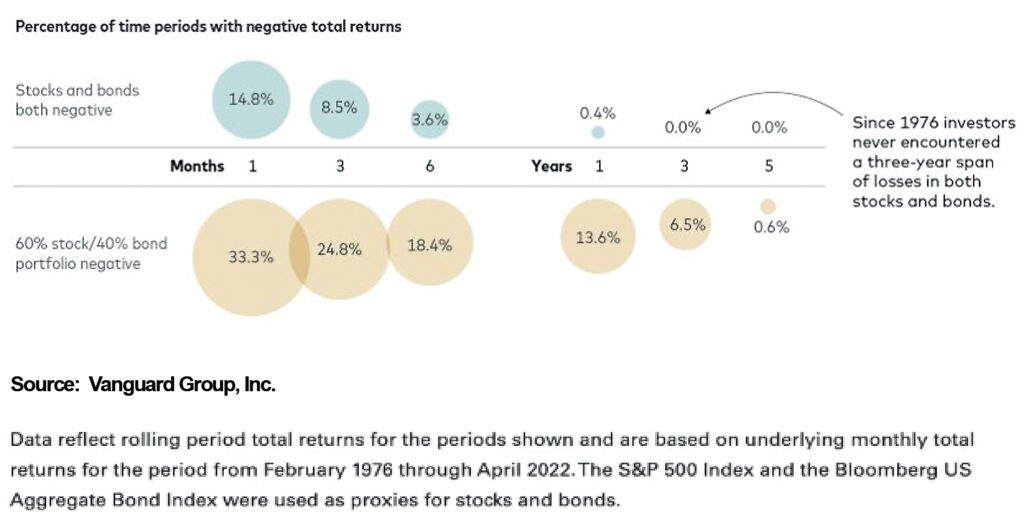
Drawing our attention to the rightmost data on the chart, 2022 is clearly a major anomaly, as both equity and fixed income returns are negative. In our data set of annual returns going back to 1976, this is the only time this has occurred, although when looking outside the constraints of calendar years, there have been numerous instances of rolling periods with negative returns for both stocks and bonds. The below illustration from Vanguard shows that longer periods of correlated negative returns in stocks and bonds are somewhat rare, and coincident negative performance has never persisted for a three-year span. While this does nothing to erase painful year-to-date losses, it does provide a strong argument for discipline in adhering to what has been a time-tested asset allocation approach.
With nearly three-quarters of 2022 in the books, it looks unlikely that stocks and bonds will stage a miraculous year-end turnaround to reach positive territory, given the aggressive projections for Fed rate hikes into 2023. However, unexpected data surprises from inflation or corporate earnings could potentially soften what has been a tough year for investor portfolios. The Fed’s plan to cool economic growth (read our analysis here) has put earnings estimates in the crosshairs, so if earnings prove resilient stocks would rebound nicely given their now-lowered P/E multiples. Conversely, if corporate earnings weaken and reinforce the narrative of a recession on the horizon, bond yields will likely decline as investors reallocate to fixed income.
2022 has certainly felt more painful than most years due to the simultaneous declines in stocks and bonds, coupled with abnormally high inflation diminishing the relative safety of cash. However, the data leads us to remain confident that the 60/40 portfolio, and many other combinations of stock/bond, remains a time-tested, proven approach for most investors to manage volatility and reach their financial goals.
Click here to download a copy of advisory.
Thank you for the opportunity to be of service.