
The Fed’s Two-Pronged Monetary Blitzkrieg, Pt 1 – Surveying The Damage
March 7, 2024
By Dr. George Calhoun
Vestbridge Advisors, Inc. Advisory Board Member
Executive Director of the Hanlon Financial Systems Center

- “My advice has constantly been: ‘Don’t do QT before you get your interest rates in order. Doing both at the same time makes things much more complicated and could create problems.” – Raghuram Rajan (former governor of the Reserve Bank of India, now Professor of Finance at the University of Chicago), cited by CNN
In 2021 and 2022, the Federal Reserve launched two different highly restrictive monetary policies, pursuing each of them quasi-independently, with an aggressiveness that has shocked and disrupted financial markets and distorted many of the economic signals which investors and regulators traditionally rely on. The real economy has been caught in a squeeze, with significant collateral damage in several sectors.
The two prongs of this program were — in order of appearance –
Quantitative Tightening
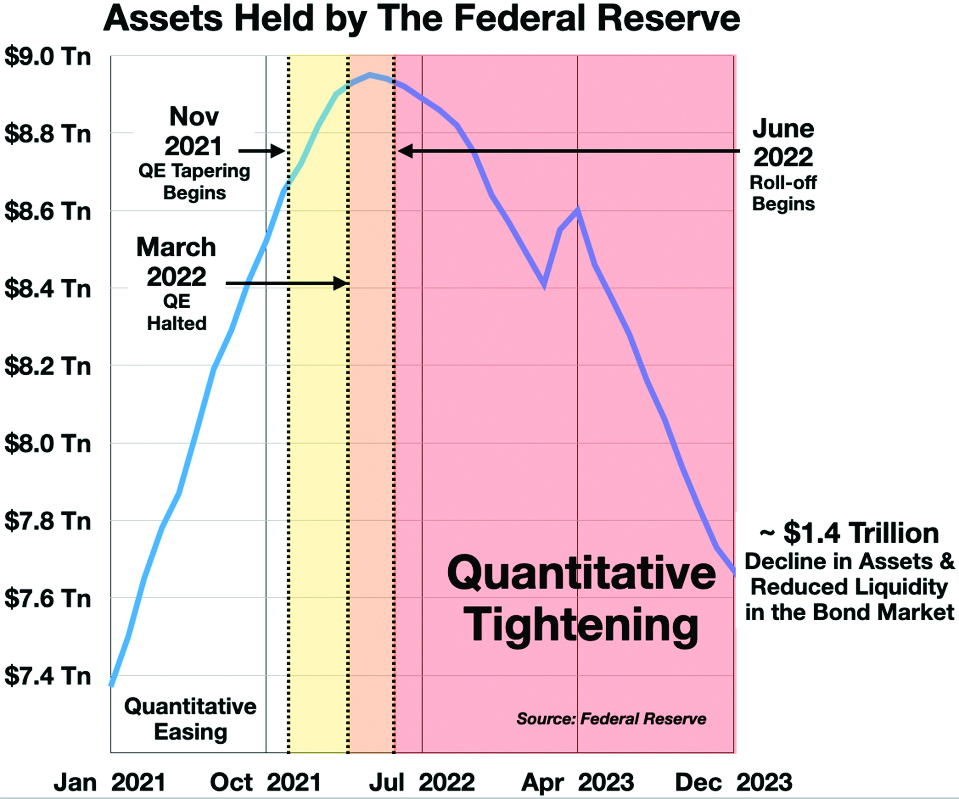
- Starting in November 2021, the Fed shifted from buying vast quantities of government bonds relentlessly – one might say almost indiscriminately – injecting billions and ultimately trillions of dollars into the economy (so-called “quantitative easing” or QE), to at first slowing (“tapering”), then halting, and finally reversing the process, by allowing its maturing bonds to “roll off” without replacement (“quantitative tightening” or QT), effectively withdrawing more than $1.4 Trillion in liquidity back out of the market.
Raising Interest Rates
- A few months later, in March 2022, the Fed began to hike up interest rates with unprecedented intensity.
Differing Objectives
The two policies were developed more or less separately, and their goals are only partially compatible.
- The shift to QT was primarily intended to wean the financial markets off the addictive stimulant that QE had become, and to reduce the size of the Fed’s balance sheet, which had bloated out to almost $9 trillion, equal to about 35% of the gross domestic product of the United States.
- Interest rate increases, on the other hand, were designed to “combat inflation.”
Both are restrictive, but with different targets. QT focuses on adjusting the nature of the Fed’s intervention in the financial markets, while the rate hikes are designed to impact consumer behavior in the real economy. These two policies and their effects overlap, but without (it seems) a clear coordinating principle. They have taken policy-makers into “uncharted territory.”
The Uncertainties of QT
This is particularly true for the Quantitative Tightening program. QT is a novel experiment. It has never really been thoroughly tested in practice. No one can really claim (yet) to be sure of its effects. In May 2022, just before the start of the “roll off” period – that is, prior to the start of QT proper – Fed Chairman Powell put it this way:
- “I would just stress how uncertain the effect is of shrinking the balance sheet. You know, we run these models—and everyone does in this field—and make estimates of what will be, how do you measure, you know, a certain quantum of balance sheet shrinkage compared to quantitative easing? And, you know, these are very uncertain. I really can’t be any clearer.”
We are now approaching a trillion and half dollars into this experiment, and the situation is still unclear. Past experience, however, is not reassuring. In October 2017, the Fed began a short-lived and more modest program of QT, which now looks like a sort of “trial run.” It was seen by the Fed leadership at the time as low-risk. Janet Yellen (the Fed Chair) was famously nonchalant: “It will be like watching paint dry. This will just be something that runs quietly in the background.”
Nevertheless, many observers were worried. A typical caution offered:
- “QT has never been done before, especially on such a massive scale. This worries many investors, because the likely effect is that it will raise the cost of borrowing and reduce asset prices.”
In the event, the pessimists were probably right. In January 2019, The New York Times reported signs of anticipatory market stress even before the program started:
- “As part of its campaign to rescue the economy after the 2008 financial crisis, the Fed bought enormous quantities of bonds issued or guaranteed by the federal government. Now the question is how quickly, and by how much, it will shrink that pile….
- “Last year, the Fed’s portfolio declined by more than $350 billion — the sharpest reduction since the crisis. You may have also noticed that the financial markets were battered last year. Almost every type of investment seemed to suffer the same lackluster returns. The S&P 500 was down 6.2 percent. High-quality corporate bonds sank 6.4 percent. United States Treasury bonds generated a paltry 0.9 percent return. A collapse in crude oil prices sent commodities down more than 15 percent. In fact, it was the first time in decades that virtually all major classes of investments suffered in sync, with none posting returns in excess of 5 percent.”
Months later, in September 2019, the sudden “mayhem” in the “repo” market (repurchase agreements used by large financial players to manage liquidity, and closely linked to treasury bond market conditions) forced an abrupt reversal. CNN summarized the episode as follows:
- “When the central bank tried QT, shrinking the size of its balance sheet between 2017 and 2019, trouble soon followed in some markets. In September 2019, for example, the US overnight lending market — which banks use to quickly and cheaply borrow money for short periods — seized up unexpectedly. The Fed had to intervene with an emergency infusion of liquidity.”
QT was suspended. $650 Bn in bonds had rolled off, but the Fed quickly restored QE and bought back $400 Bn in the next few months.
The current QT program is larger, faster, and more worrisome. $1.4 Tn worth of Treasury bonds and other holdings have already been allowed to roll off without replacement. The questioning this time is more urgent. Combining the effects of QT in the U.S. and the UK, CNN asked:
- “What happens when $2 trillion is sucked out of the global economy? It may not be pretty.”
An academic study last year led by Raghuram Rajan, the former governor of the Reserve Bank of India, now Professor of Finance at the University of Chicago, concluded that:
- “The past expansion of the Fed’s balance sheet left the financial sector more sensitive to potential liquidity shocks when the Fed started shrinking it, necessitating Fed liquidity provision in September 2019 and again in March 2020. If the past repeats, the shrinkage of the central bank balance sheet is not likely to be an entirely benign process.”
By May 2023, after almost a year of QT, CNN was worried that it was “a high-stakes experiment — one that may be impossible to unwind without destabilizing the financial system.”
No new crisis has ensued, but it is the nature of crises that they arise suddenly and unexpectedly (as happened in September 2019). In short, the verdict on QT is still uncertain, at best.
The Interest Rate Hikes: Aggressive but Ineffective
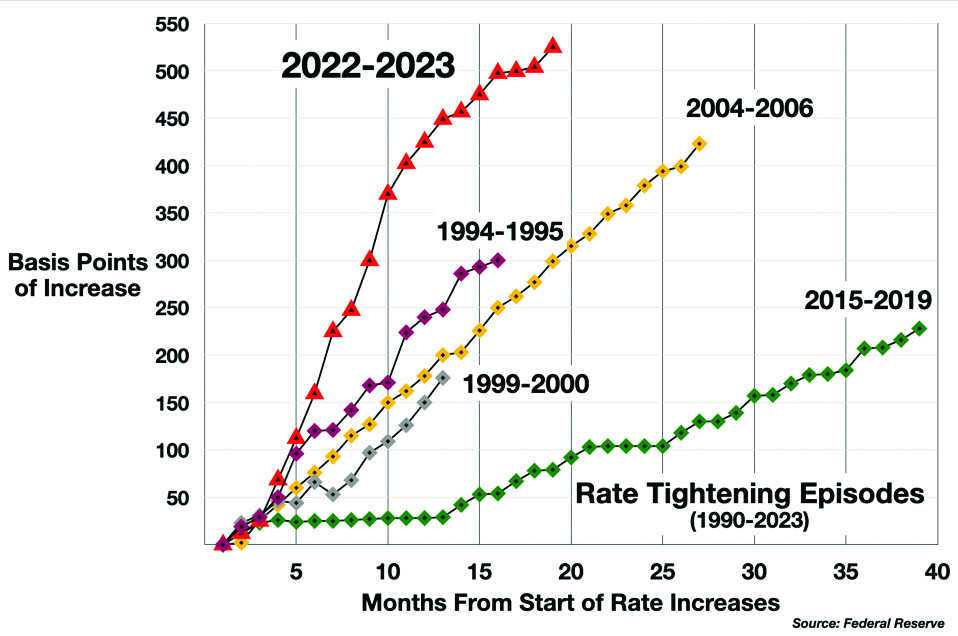
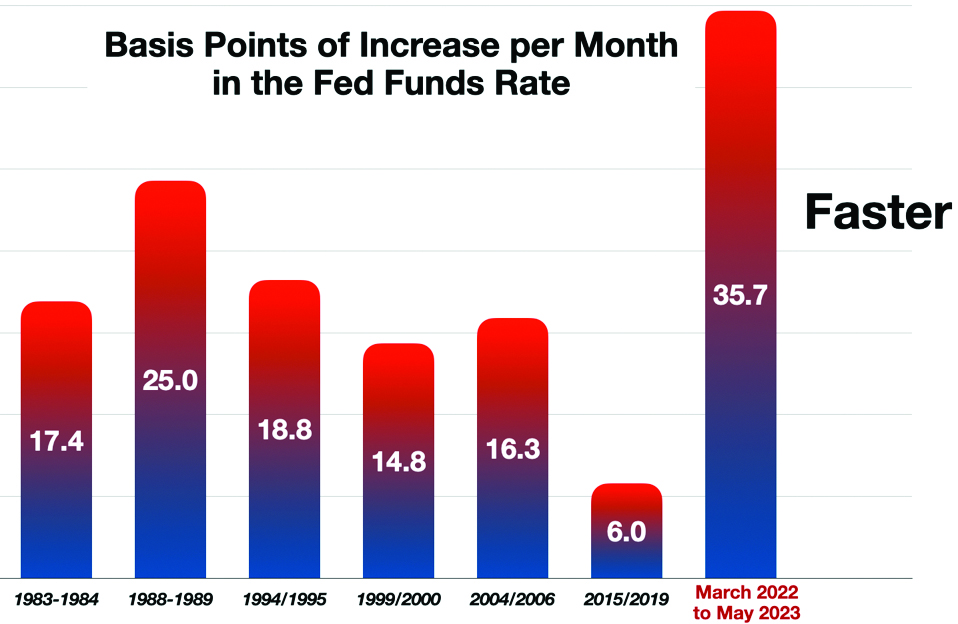
Meanwhile, the Fed’s rate hike trajectory in 2022 and 2023 was higher and steeper than at any time in the last 40 years.
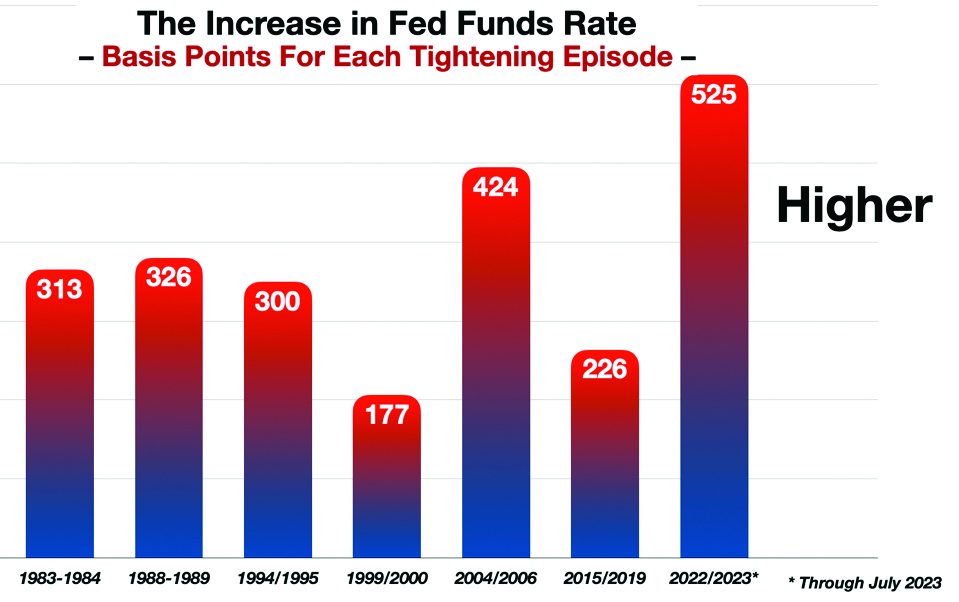
Starting in March 2022, the Fed jacked up the Fed Funds target rate by 500 basis points over the next year – 35 bps per month, twice as fast as any rate-tightening program since the 1980’s.
And yet, by the time the Fed acted, inflation was already running out of steam. It had slowed significantly by the 3rd quarter of 2022, with an annualized 3-month inflation rate of 1.9% (using the headline Consumer Price Index) – well before the economy could have registered the impact of the Fed’s then-still-modest rate hikes.
More importantly, it has become clear that the 2021-2022 inflationary episode was caused by supply chain constraints, bottlenecks and shortages – which were in turn caused by the vast but temporary dislocations arising from the twin shocks of the pandemic and the Ukraine war. Raising the interest rate cannot fix supply-side inflation. (If anything, higher rates may make things worse by constricting credit to suppliers needing to invest to unblock their distribution channels.) In terms of its stated goal, the rate hike policy has been ineffectual. But that does not mean it was without effect.
The Unintended Consequences
If the QT program creates uncertainty and potential risk for the financial system, and the rate increases are ineffective against inflation, what has been the actual impact of these restrictive policies?
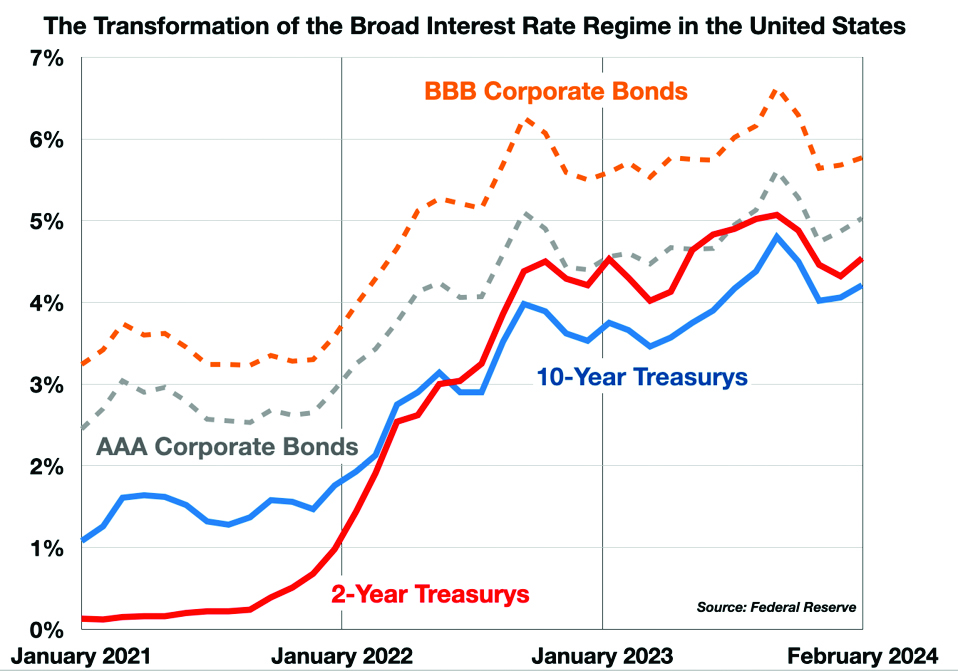
First of all, the combined force of the Fed’s two semi-coordinated campaigns transformed the entire interest rate regime in the United States. Credit became much more expensive across the board, returning to levels not seen since before the Financial Crisis of 2008. It abruptly ended a long period of “easy money” and negative real interest rates.
At least two anomalies appear in this picture, which indicate a complex interaction between QT and the rate hikes.
The 2nd Longest Yield Curve Inversion Ever Recorded
First, the Treasury Bond yield curve (the 10-Year to 2-Year yield spread) inverted on July 6, 2022 — and it is still inverted 610 days later (through March 7, 2024). This is now the 2nd longest inversion episode in history. (The previous record was 622 days for the inversion that ended in 1980. The current inversion will surpass this mark in another two weeks.) Moreover, despite this extraordinarily long inversion, no recession has materialized – breaking the classic pattern.
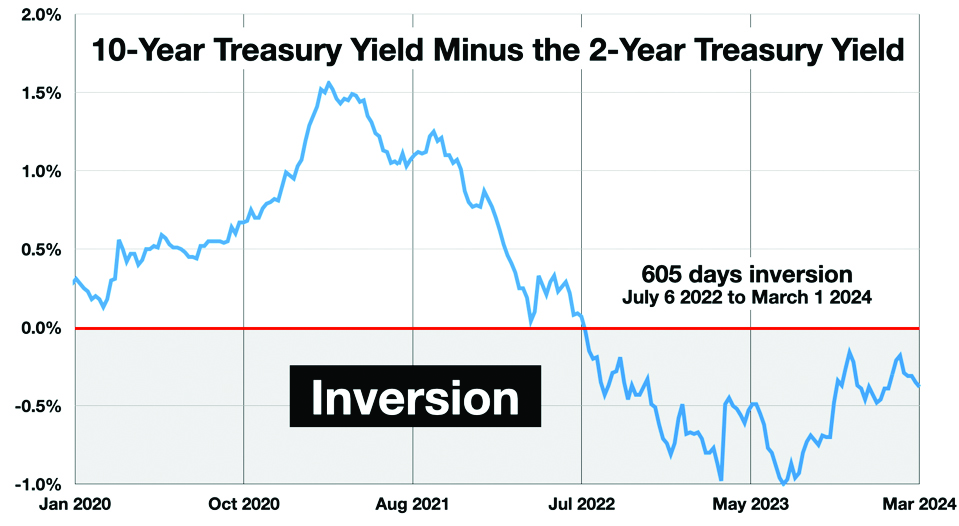
It is clear that something out of the ordinary is taking place. The aggressive QT program is interacting with the rate increases. It has negated $1.4 Trillion of replacement demand for government bonds, and has distorted the normal transmission channel for interest rate policy changes.
Treasurys More Impacted than Corporate Bonds
As the interest rate regime ratcheted upwards, it affected all categories of fixed income securities. However, yields on Treasurys increased more, from trough to peak, than the yields on investment-grade corporate bonds. That is, the prices of Treasurys were abnormally impacted, and depressed, relative to corporate bonds.
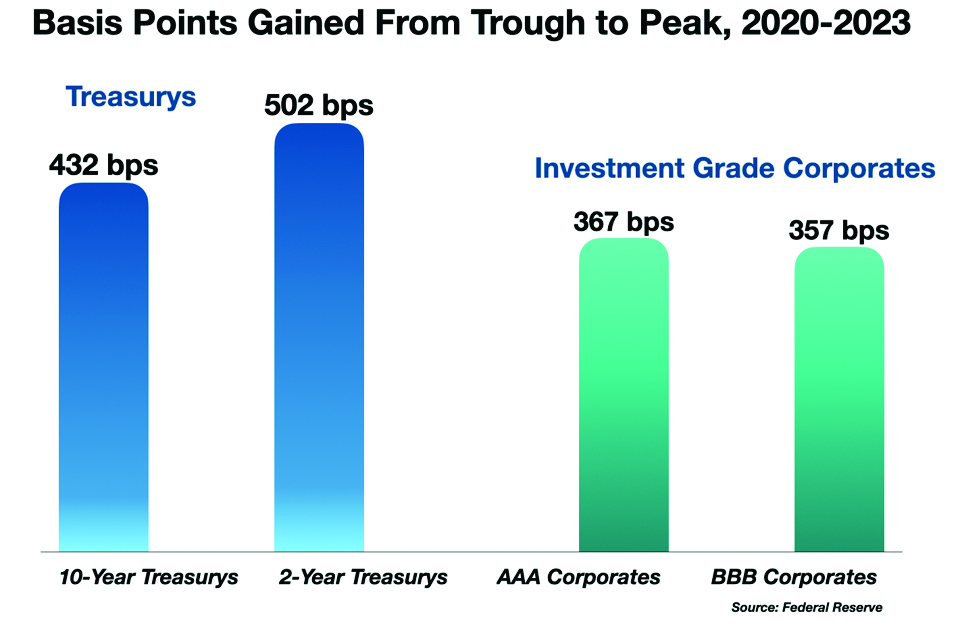
This is the second anomaly. Typically, in a general sell-off, Treasurys should suffer less than corporates. Treasurys have zero credit risk, while all corporate bonds price in some risk of default. As the classic safe haven asset, Treasurys should therefore hold their value better than corporates.
Again, the obvious explanation is that the disappearance of the Fed as a buyer has weakened the Treasury market, while no corresponding demand deficit appeared in the corporate fixed income sector.
Both anomalies suggest that the credit markets have been distorted by the interaction of QT and the rate hikes. (I will explore this further in the next column.)
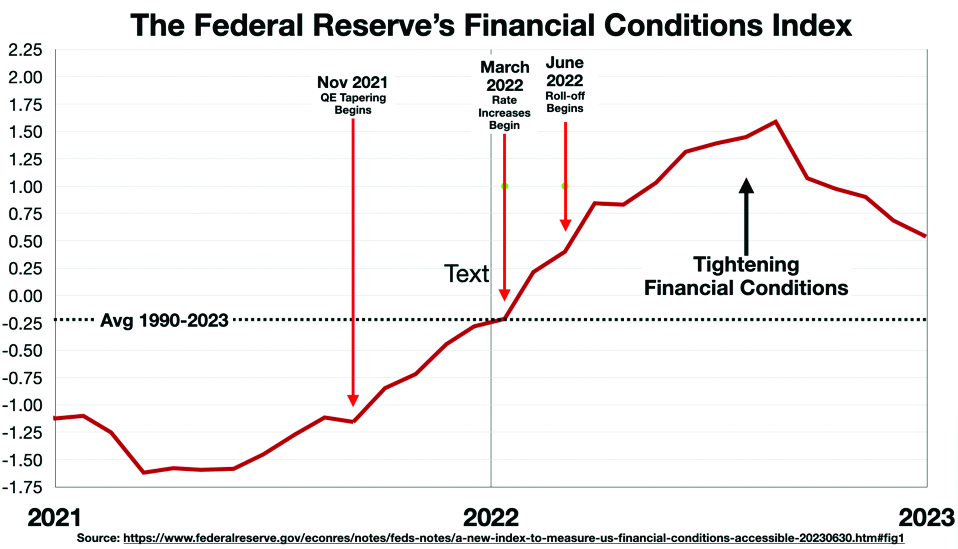
Deteriorating ‘Financial Conditions’
Last year, the Federal Reserve debuted a new measure of stress in the financial system, called (rather awkwardly) the Financial Conditions Impulse on Growth (FCI-G), and described as follows
- “The index introduced aggregates changes in seven financial variables—the federal funds rate, the 10-year Treasury yield, the 30-year fixed mortgage rate, the triple-B corporate bond yield, the Dow Jones total stock market index, the Zillow house price index, and the nominal broad dollar index.”
FCI-G is similar in spirit to other Financial Conditions Indexes offered by various entities (inducing well-known FCI’s from Bloomberg and Goldman Sachs).
The Fed’s new index shows that financial system stress hit a peak in 2023.
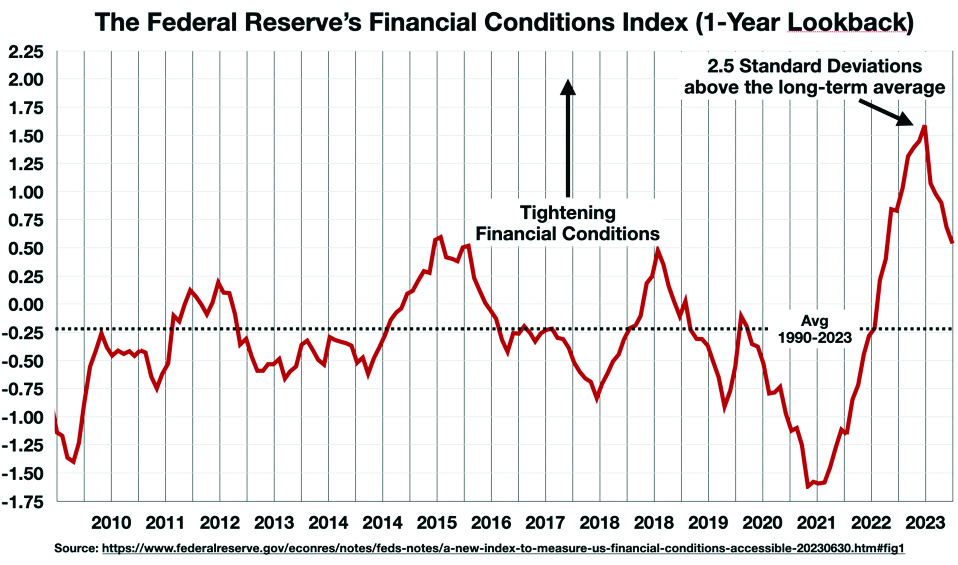
The systemic stress was apparently synchronized with the onset of monetary tightening.
Damage to the Real Economy
QT and the rate hikes are interacting in unplanned and unpredictable ways, amplifying each other, and this is clearly causing distortions in some financial markets. (The 600 day long Yield Curve Inversion is not some “new normal.”)
As well, the unintended consequences of these distortions are beginning to cause significant distress in many corners of the real economy.
A survey of the worst damage zones would include:
- The Housing Market – Mortgage Rates have surged, driven by the Fed’s interest rate hikes, which has dampened demand for housing – but there are indications that QT has further exacerbated credit conditions for the housing market, depressing sales and prices more than what would be expected from the rate hikes alone (see the next column for details).
- Rising stress in the Banking Sector, including the rising cost of interest paid on deposits (bad enough), liquidity shortages and heightened potential for bank “runs” (worse), and drastic losses on banks’ bond holdings with severe damage to bank’s balance sheets (worst).
- An Over-Strong Dollar is having a negative impact on foreign firms and governments especially in emerging markets
- The rising Cost of Servicing the Federal debt, and the corresponding growth of the deficit, will creating fiscal stress in the coming years.
- Stress in the Treasury Bond Markets and related sectors of the core financial systems (e.g., Repo markets), especially as record amounts of new Treasurys are required to re-fund the federal debt (in the absence of QE demand).
- Increased Stress on Small companies from higher credit costs.
- Losses impacting the Federal Reserve’s own P&L (transmitted to the Treasury).
All of this should give pause, at least, to supporters of the current Fed position. Policies which appear to fail in their stated purpose, and yet clearly inflict collateral damage on the scale of trillions of dollars to other sectors of the economy, deserve to be re-examined. I will address some of these damage zones in detail in forthcoming columns.
Follow me on Twitter or LinkedIn.
About the Author:
Dr. George Calhoun, a graduate of the University of Pennsylvania, received his Doctorate Degree from the Wharton School of Business. He has served in multiple capacities in the Financial Sector and in the Wireless Communication Industry. He has authored multiple articles on subjects of interest to him and several books. His most recent book “Price & Value: A Guide to Equity Market Valuation Metrics” is available through the Publisher Springer/Aspress. Dr. Calhoun currently serves as the Executive Director of the Hanlon Financial Systems Research Center at the Stevens Institute of Technology and is an Advisory Board Member of Vestbridge Advisors, Inc.
Vestbridge Advisors, Inc. (“VB”) Is registered with the US Securities and Exchange Commission as a registered investment advisor with principal offices at 3393 Bargaintown Road, Egg Harbor Township, NJ. The information contained in this publication is meant for informational purposes only and does not constitute a direct offer to any individual or entity for the sale of securities or advisory services. Advisory advice is provided to individuals and entities in those states in which VB is authorized to do business. For more detailed information on VB, please visit our website at www.Vestbridge.com and view our Privacy Policy and our ADV2 Disclosure Document that contains relevant information about VB. Although VB is a fairly new organization, any references herein to the experience of the firm and its staff relates to prior experience with affiliated and nonaffiliated entities in similar investment related activities. All statistical information contained herein was believed to be the most current available at the time of the publishing of this publication.