
Is The Risk-Free Rate Truly Risk-Free?

April 12, 2023
“Risk” is a something of a loaded word, having a somewhat negative implication. Most people only focus on the downside risk, and when we hear about “risky” investments it is typically in reference to penny stocks, cryptocurrencies, and other speculative instruments. The accepted meaning of “risk” in financial jargon, however, is typically to convey standard deviation, which encompasses both potential underperformance and outperformance relative to a mean expectation for investment return. After all, risk can lead to both losses and gains, otherwise no reasonable investor would ever take on any risk.
If you are even casually familiar with the Capital Asset Pricing Model (CAPM), you’ve heard the term “risk-free rate”. The risk-free rate (RFR) is a theoretical measure of an investment with zero risk, over a specified period. Typically, the 3-month Treasury Bill (T-Bill) is used to represent the RFR, given the near-zero probability of the US government defaulting on its short-term debt. The 3-month T-Bill currently stands around 4.8%, the highest yield since 2007. Earning an annualized 4.8% with zero risk certainly seems enticing, and investors have taken note, funneling cash into money market funds which now hold a record $5.2 Trillion in investor deposits.
A recent research note from JPMorgan’s Global Equity strategists suggested that investors should underweight US stocks in favor of “risk-free” short duration holdings such as the 3-month T-Bill, arguing there is too much uncertainty as the Fed struggles to maintain its monetary policy against a volatile geopolitical backdrop and fragile global growth. It is a compelling argument and for risk-averse investors, collecting a near-5% return with virtually no downside certainly provides peace of mind in a stressful market. With the Fed proclaiming it will hold Fed Funds rates around or possibly above 5% for the duration of the year, investors can lock in a similar return, get an early start on summer vacation, and check back in around 2024, right?
Of course, things are never so simple. The risk-free rate is actually the “nominal” RFR, and fails to account for the elephant in the room, inflation. The so-called “real risk-free rate” is computed by backing out inflation. There are a multitude of inflation measures but if we use the Fed’s preferred measure, Core Personal Consumption Expenditures, which is currently 4.6%, we can see how the actual “risk-free” return is basically reduced to zero. While this sounds much less attractive, knowing that 3-month T-Bills provide an opportunity to avoid losing purchasing power to inflation can still be a winning strategy for risk-averse investors.
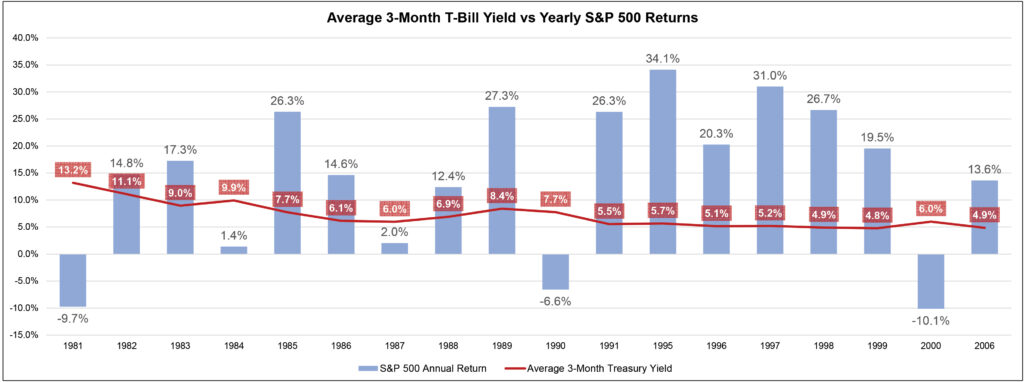
Aside from inflation, there is also the risk of opportunity cost in abandoning equity markets. It has been over 15 years since the 3-month T-Bill has yielded over 4.8%, so some newer investors may have never experienced a similar market and other, more seasoned investors may have forgotten that stocks can still appreciate in a high interest rate setting. Surprisingly, it is actually more common than not, looking at returns going back to 1981. To illustrate, the below chart shows the 18 years since 1981 in which the 3-month T-Bill yield averaged 4.8% or above during the annual period. The S&P 500 had a positive return in 15 out of these 18 years, and its annual return exceeded the respective average 3-month T-Bill yield in 13 out of 18 years, providing double-digit returns in all such instances.
There is no guarantee that equity markets will provide double-digit returns this year, or even positive returns. But given last year’s near-18% decline in the S&P, lower expectations for both earnings and economic growth, and the uncertainty of the Fed’s ability to maintain rate hikes much longer, there are plenty of potential catalysts for a reversal in sentiment that would surely draw some of cash off the sidelines and back into equity markets.
As investors, the most important thing we can do is be honest with our assessment of risk, not just on the downside but also in regards to fear of missing out (FOMO), and then position our portfolios in a way that aligns with investment time horizon. Today’s market conditions are an opportunity for investors to put a financial plan in place that can maximize the benefits of both high short-term rates and potentially attractive equity markets, by properly allocating funds needed near-term to T-Bills and similar fixed income positions while maintaining exposure to equities in longer-term oriented accounts. Remember, risk can perform up or down.
Vestbridge Advisors, Inc. (“VB”) Is registered with the US Securities and Exchange Commission as a registered investment advisor with principal offices at 3393 Bargaintown Road, Egg Harbor Township, NJ. The information contained in this publication is meant for informational purposes only and does not constitute a direct offer to any individual or entity for the sale of securities or advisory services. Advisory advice is provided to individuals and entities in those states in which VB is authorized to do business. For more detailed information on VB, please visit our website at www.Vestbridge.com and view our Privacy Policy and our ADV2 Disclosure Document that contains relevant information about VB. Although VB is a fairly new organization, any references herein to the experience of the firm and its staff relates to prior experience with affiliated and nonaffiliated entities in similar investment related activities. All statistical information contained herein was believed to be the most current available at the time of the publishing of this publication.