
Presidential Election Market Cycle Suggests Possible Market Bottom
The value of the stock market, at any given time, is essentially the price investors collectively are willing to pay for the future earnings of the companies comprising the market. In determining the value of these future earnings, investors consider a plethora of variables, ranging from individual companies’ balance sheets to major geopolitical events. When we encounter periods of heightened volatility in the market it is reflective of atypically high uncertainty over a host of issues.
The market dislikes uncertainty because it makes future earnings harder to predict. One current uncertainty, which will have a definitive timeline for a resolution, is the US mid-term elections in November. Polls indicate that the Republicans will likely take control of the House of Representatives and could also potentially wrest away control of the Senate as well. Whatever happens, the resolution of this uncertainty should help reduce volatility in the markets, as it removes at least one of the many variables from play. Any gains for the Republicans will likely be viewed as a positive by the markets as it could result in political gridlock, which is desirable from an investing standpoint, because it removes the potential for legislative changes that could have negative impact on the markets.
While we can’t predict who wins the elections and we can’t forecast the path of geopolitical events, we can look at the data from past election cycles for clues to how the markets may behave. We have analyzed the past 69 years’ worth of S&P 500 monthly returns and grouped them into 4-year Presidential cycles to identify potential patterns in market behavior. If we take the composite seasonal performance of the S&P 500 during the 4-year Presidential cycle, the low point for markets often comes in the 2nd year of an administration’s term. We can see this in the chart below. This would correspond to this year, year two of President Biden’s first term, according to the cycle.
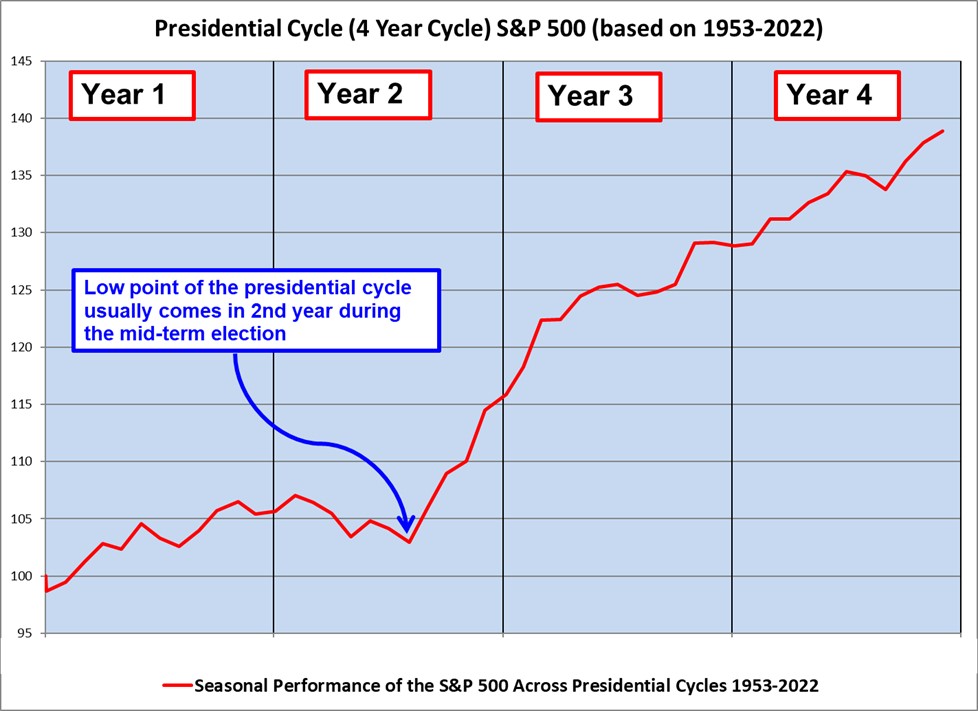
The cycle suggests that the first two years of the presidential cycle are less beneficial to the market. The 3rd and 4th years generally end up being positive, although some volatility is unavoidable. Logically, this makes sense as administrations try and boost the economy in the second half of their first term in the hopes that the stimulated economy will carry them through the election and into a second term. Historically, the last time the S&P 500 has produced negative returns in the year following a midterm election was 1939.
Of course, this is just the average pattern of roughly seven decades’ worth of data, and not a foolproof prognostication on how the market will perform in the latter half of the Biden administration. The market faces an uphill battle with the Federal Reserve actively working against economic growth; but much can occur in two years’ time, and one must imagine that the Biden administration is privately putting pressure on the Fed to contain the economic damage and back off from its aggressive rate hikes.
For investors, information is an ally and uncertainty a foe. When the November elections pass, we will have one less uncertain data point. Armed with the information that Presidential Cycles typically bottom out in year two, investors may be able to capitalize on opportunities to re-establish market positions in undervalued asset classes heading into 2023. If the Fed pivots in any way, we could very well see a rapid breakout from the year-long bear market downtrend.
This is another of numerous present and historical market conditions that suggest a bottom in the equity markets may be approaching.