
Does Raising The Fed Funds Rate ‘Tame’ Inflation? Is There Collateral Damage?
July 17, 2023
By Dr. George Calhoun
Hanlon Investment Management Advisory Board Member
Executive Director of the Hanlon Financial Systems Center
- “Federal Reserve officials’ concerns about stubbornly high inflation could lead them to signal that they are prepared to lift interest rates again this year…” – WSJ (June 13, 2023)
- “Fed chair [Jerome Powell] and his colleagues ‘almost overwhelmingly…think that we need to do more to get to a level of tight policy.’” – WSJ (June 29, 2023)
- “Interest rates will keep rising and stay elevated, central banks warn” – FT (June 29, 2023)
To raise, or not to raise… the Fed Funds rate –
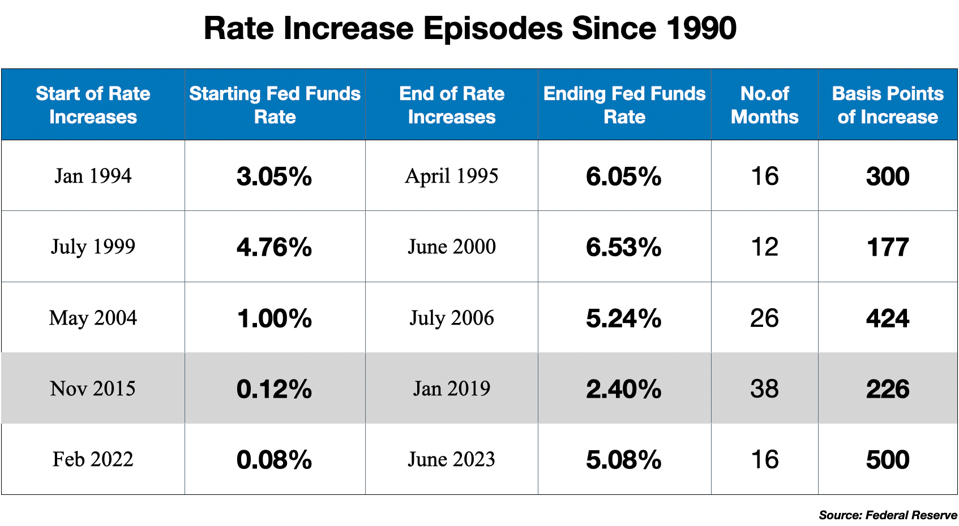
That has been the dominant question for the Federal Reserve and for the financial markets over the past year and a half. The benchmark rate has been bumped up 500 basis points in 14 months (March 2022 – May 2023), the steepest tightening program in decades.
Is this extraordinary attack plan working? Inflation metrics are showing signs of easing (and properly construed, the inflationary episode has demonstrably ended – but that is another story – see my earlier columns, referenced at the end of this article). Nevertheless, the Fed is leaning hard now towards continuing to ratchet up the rate.
In the middle of these calculations is the idea that there is a “long and variable lag” between Cause (rate increases), and Effect (the “taming” of inflation). Milton Friedman coined this catchphrase 60 years ago. He identified a delay of anywhere from 4 to 29 months – averaging 16 months – between the Fed taking action and the impact on prices and general economic conditions. His pragmatic conclusion was that the unpredictable delay renders discretionary Fed policy moot.
- “I find it virtually impossible to conceive of an effective procedure when there is little basis for knowing whether the lag between action and effect will be 4 months or 29 months or somewhere in between.”

Today, hardly a Federal Reserve official speech or press conference goes by without referencing the lag. It is seen as part of the “science” of monetary policy. In effect, the lag concept asks us to postpone judgment about the efficacy of the rate increases as we wait for things to play out.
Does this lag exist? Do rate increases actually have any significant impact on consumer prices? Or does inflation wax and wane more or less independently? Are rate hikes an effective policy for fighting inflation?
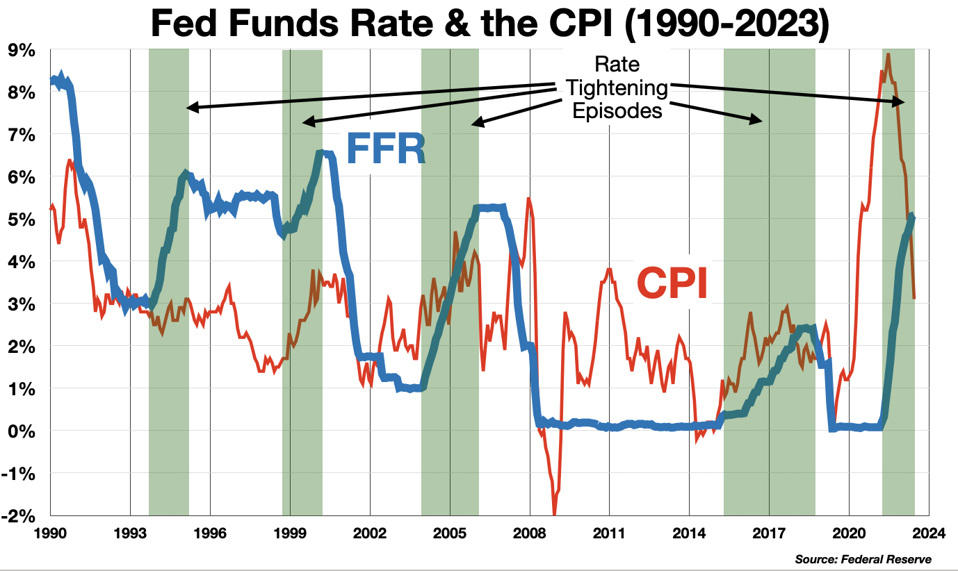
My previous column examined the question in terms of two related techniques for measuring a possible connection between the Fed Funds Rate (FFR) and the Consumer Price Index (CPI).
- Correlation: Does the changing level of the FFR over time correlate with (move in sync with) the level of inflation 6 to 24 months later?
- Linear Regression: Is there a relationship between the FFR and the lagged year-over-year CPI such that knowing the FFR can allow us to predict the lagged CPI?
Analyzing the monthly data for both variables over the period from 1990 to 2023, it appears that the answer to both questions is No.
There is no observable relationship between the Fed Funds Rate and the CPI 12 or 18 months later. Even if we remove the periods of Quantitative Easing where the FFR is “artificially” suppressed, there is no discernible relationship.
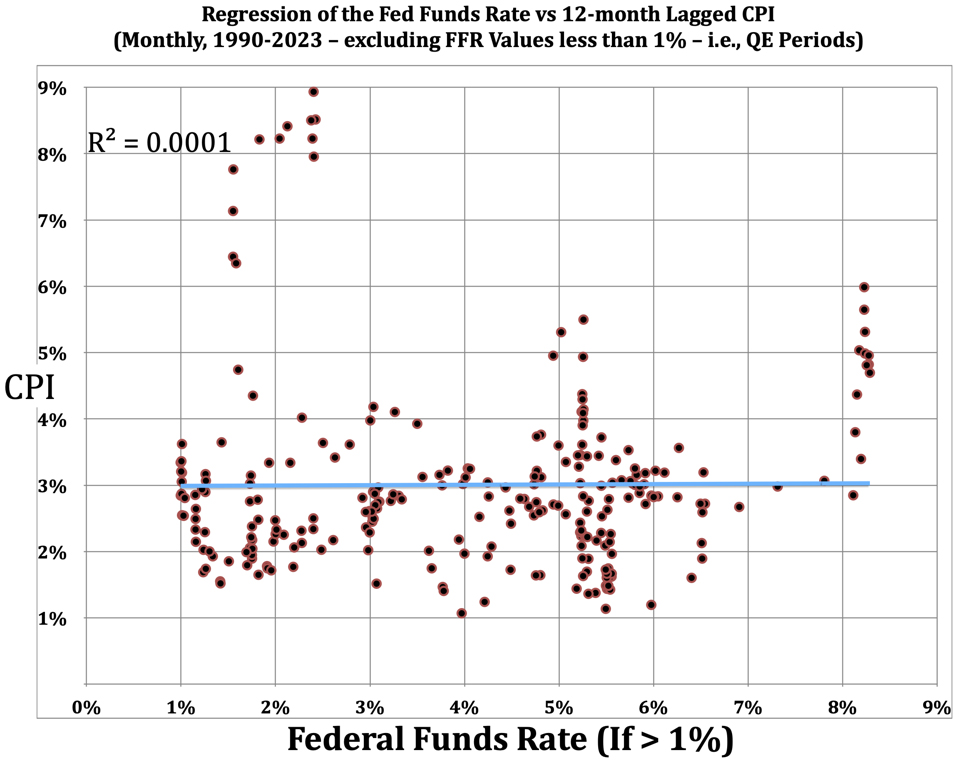
If there is assumed to be a causal relationship between rate increases and inflation control (with a lag), it ought to show up in these numbers to some degree. The possible significance of this negative result is that Fed interest rate policy may be ineffective, with little or no impact on inflation in the following periods.
On the other hand, these aggressive rate increases certainly have had side-effects, some of which are rather nasty. For example, as interest rates across the industry rose and bond prices fell, banks suddenly found that the market value of their investment securities, carried as assets on their balance sheets, was severely impaired. Unrealized losses for the banking industry exploded by a factor of 70 from Q4 2021 to Q3 2022. (Which drove several middle-sized firms into bankruptcy.)
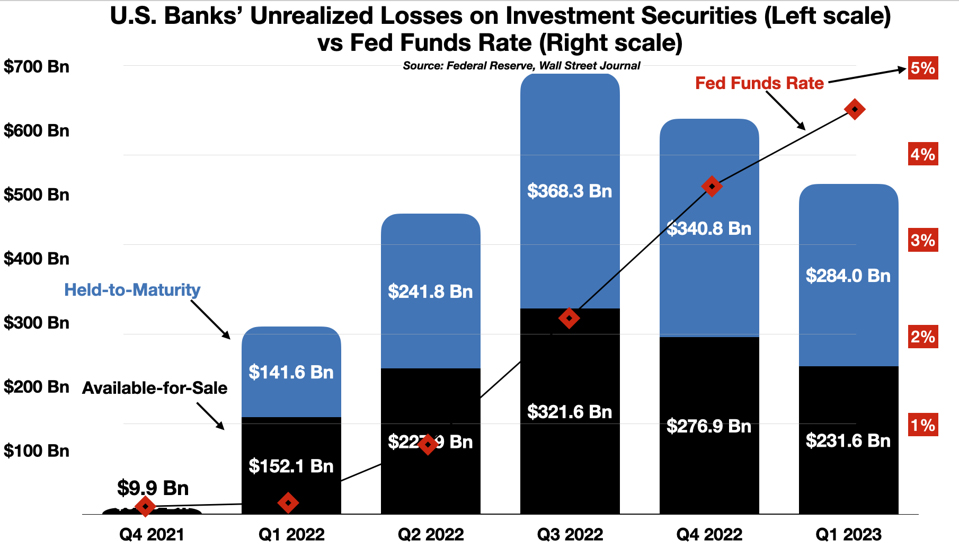
70 times increase! In 9 months! That should get our attention.
In an era where we now count in “Trillions,” a mere $700 billion in value destruction may seem less important. But it shows that even if the Fed’s aggressive rate-raising campaign is ineffective, it is not harmless. More on that below.
The Link with Explicit Monetary Tightening Episodes
These statistically “flattened” pictures can obscure important information, however. Averages, correlations, regressions, all are designed to smooth out “irregularities.” Yet there are plenty of important “irregularities” that enter into the picture in this period, including four recessions, three wars (two involving the U.S. directly, and now, in Ukraine, by proxy), a terrorist attack, several stock market bubbles, a real estate bubble, a financial crisis, and, of course, a pandemic.
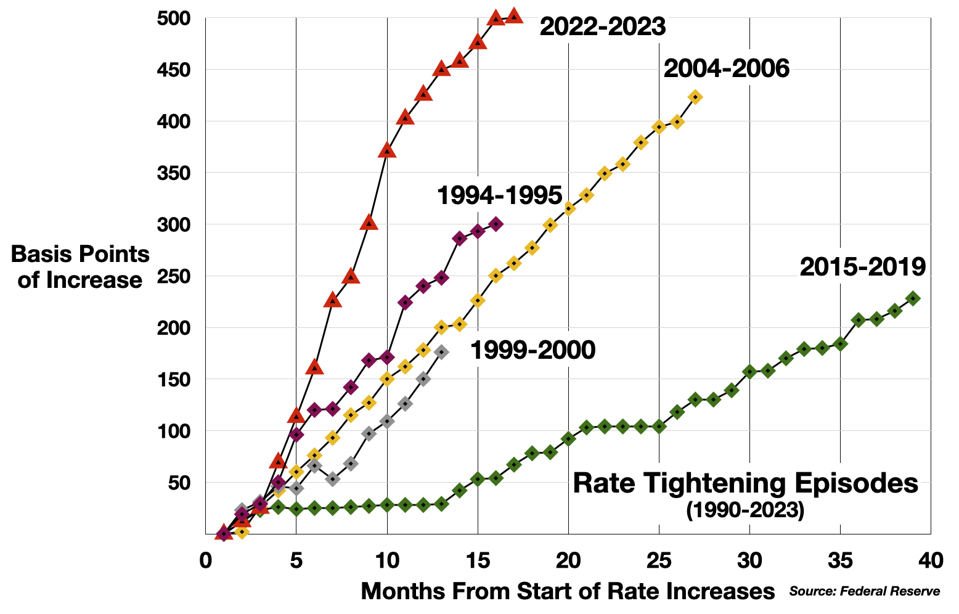
There are also differences in the macro-policy that the Federal Reserve is pursuing at any given moment. The Fed is not always in the inflation-control mode, not always raising rates. Since 1990, there have been five episodes where the Fed has boosted the FFR monotonically at least 175 basis points.
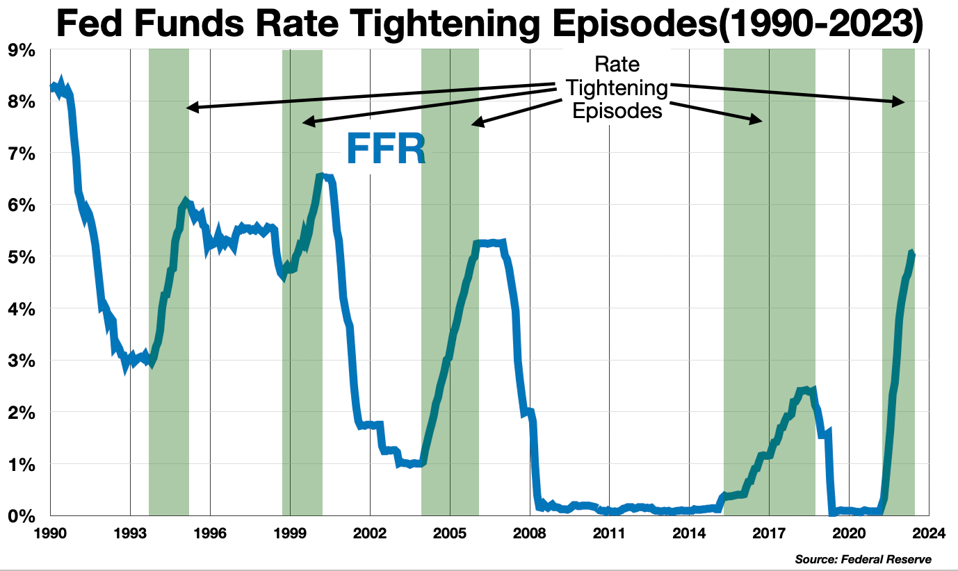
These rate-tightening periods occupy only about 26% of the 1990-2023 timespan.
A more dynamic perspective on the relationship between Fed interest rate policy and price trends can be developed from a closer study of these episodes of credit tightening.
To understand these episodes, we must leave the world of statistical technique, adopt the methods of the macro-economic historian, and consider in brief the storylines underlying and motivating each of these events.
1994 – 1995
This episode was associated with the Great Bond Massacre of 1994, and was explicitly designed to control inflation:
- “The Federal Reserve raised short-term interest rates on Feb. 4 [1994] for the first time in five years in an effort to get a step ahead on any jump in inflation and to convince traders and investors that the central bank’s anti-inflation vigilance was beyond reproof.” – NY Times (Feb 19, 1994)
1999 – 2000
In mid-1999, the stock market was reaching a peak and entering bubble conditions (the Dotcom era). Valuations were extraordinary. The Price-Earnings ratio of the entire market was almost twice the long-term post-WW2 average – prompting the Fed to begin a new tightening program.
- “For the first time since April 1994 the Fed opted to raise the fed funds rate at two consecutive Open Market Committee meetings … a sign that it wants to keep inflation in check. ‘It’s a signal to the market that the Fed means business here,’ said [a financial market analyst]. ‘It suggests the Fed is being tough on keeping inflation away.’” – CNN (August 24, 1999)
2004 – 2006
This 425 basis point step-up over 26 months was the longest sustained anti-inflation project in the whole period, although the Fed downplayed the inflation threat calling it “transitory” (sounds familiar), and positioned the program instead as moving towards a “less accommodative” policy. The backdrop at that time included the developing subprime real estate bubble, with strong inflationary implications. The threat loomed large, as noted here about halfway through the episode:
- “The [Sept 2005] rate increase was the 11th straight since June 2004 as Alan Greenspan and other central bankers seek to keep inflation under control…. To that end, the Fed pointed out that ‘higher energy and other costs have the potential to add to inflation pressures.’… ‘The Fed is growing more uncomfortable about inflation,’ said [Mark] Zandi [currently chief economist at Moody’s].” – CNN
2015 – 2019
The longest of the tightening episodes (2015-2019, 38 months) was different. It was not designed to control inflation – which was very low throughout this period. The rate increases were intended to begin the exit from a long period of artificially low interest rates associated with quantitative easing policies
following the 2008/2009 financial crisis. It was also linked with the first attempt by the Fed to engage in quantitative tightening, actively (if gently) shrinking the Fed’s balance sheet.
2022-2023
Of course the most recent rate hike program is explicitly aimed at controlling inflation. Unlike previous tightening episodes, this one did not begin until price increases had clearly taken off. The delayed response was caused in part by the assumption that most of the price increases were caused by supply shocks associated with pandemic-related dislocations in the economy. The Fed’s novel policy of seeking to “average” inflation with respect to the 2% target also played a role in the delayed response. Policymakers felt they could wait for a while even after the metrics they follow crossed above the 2% level, since inflation had been running for so long well below target.
In any case, what is most striking is that the surge in inflation precedes the Fed’s response by at least a full year.
So What Happened?
Friedman’s dictum, and the received wisdom among Fed economists, would expect to see a reduction in inflation following the end of each credit tightening program – typically about 12 to 18 months later (although some have argued recently for shorter and some for longer lags – as referenced in the previous column).
This is not what we see.
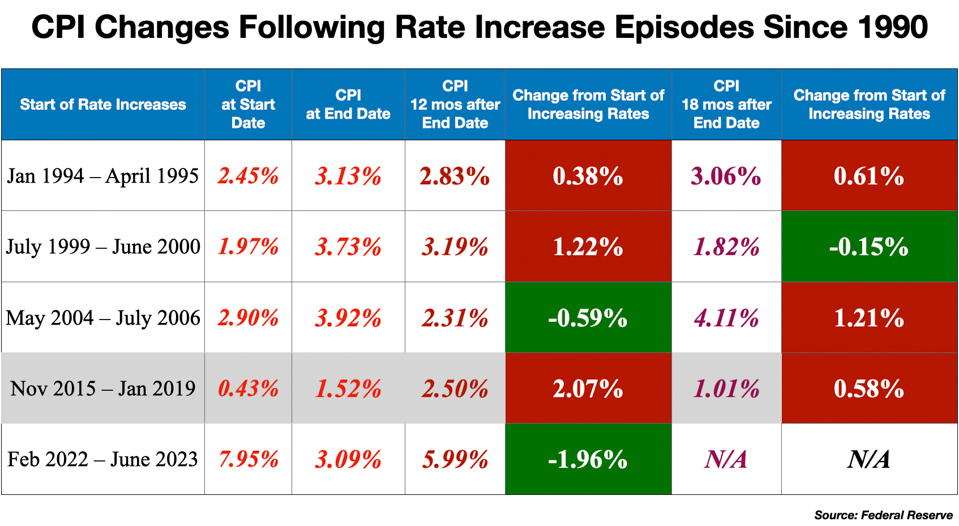
In all cases except the most recent one, inflation is higher when the rate increases end than when they began. (Of course the recent episode has not ended.)
For the most part, at 12 and 18 months following the end of the rate-increases, inflation was higher than at the start of each program.
In the 1994/1995 episode, inflation is somewhat higher both 12 and 18 months following the end of the rate increases.
In the 1999/2000 episode, it is significantly higher after 12 months, and slightly lower (15 bps) at 18 months.
The 2004/2006 episode saw inflation down half a percentage point at 12 months but up 1¼ percentage points after 18 months.
The 2015/2019 episode, as noted, was not aimed at controlling inflation. Nevertheless, raising the rates should have had some effect in containing inflation – but this was not the case. 12 months after the end of the program, inflation was more than 2% higher than when it began. 18 months later (June 2020) the full force of the pandemic had struck the U.S., with severe deflationary consequences (the CPI was near zero for the 2nd quarter of 2020). Still, the inflation rate in June 2020 was 50 bps above the level where the rate tightening had started in November 2015.
The recent inflationary outbreak started in March/April 2021. The Fed did not begin raising rates for a full year, in March of 2022 – at which point inflation (the year-over-year CPI) was running at 8.5%. Three months later, inflation had already peaked and was beginning to come down. But the Fed had hardly gotten started – the FFR was only at 1.5%, which should not have been enough to inflect the trend.
In any case, the dynamics of the most recent episode are anomalous, compared to previous rate-hike programs. There is much more to say about that in subsequent columns.
Conclusions, Conjectures
- Excluding the most recent episode, the history of the past several decades does not support the idea that rate increases can reduce inflation effectively and reliably. In the four earlier cases, inflation is either up, or more or less unchanged, 12 and 18 months after the rate hikes end. There is no “long and variable lag.”
- The most recent case, from March 2022 to the present, is different in several ways. The Fed did not anticipate, or attempt to anticipate, the onset of inflation. A full year passed before the Fed acted, and the trajectory of the CPI would seem to indicate that the economy turned the corner on inflation before we could reasonably have expected to see any real effect of Fed policy. The first three episodes were motivated by fears of inflation driven by excess demand.
- The most recent outbreak of inflation was driven by supply-chain disruptions and dislocations caused by the extraordinary circumstances associated with a global pandemic. Fed Funds rate increases have little effect on price increases created by such supply-side shocks.
- Of course it could be that inflation would have been worse had the Fed not intervened in these cases. That counterfactual is unprovable. But the negative correlation and regression results – zero interdependency between the FFR and the CPI over 33 years – over the whole series makes it hard to sustain that argument.
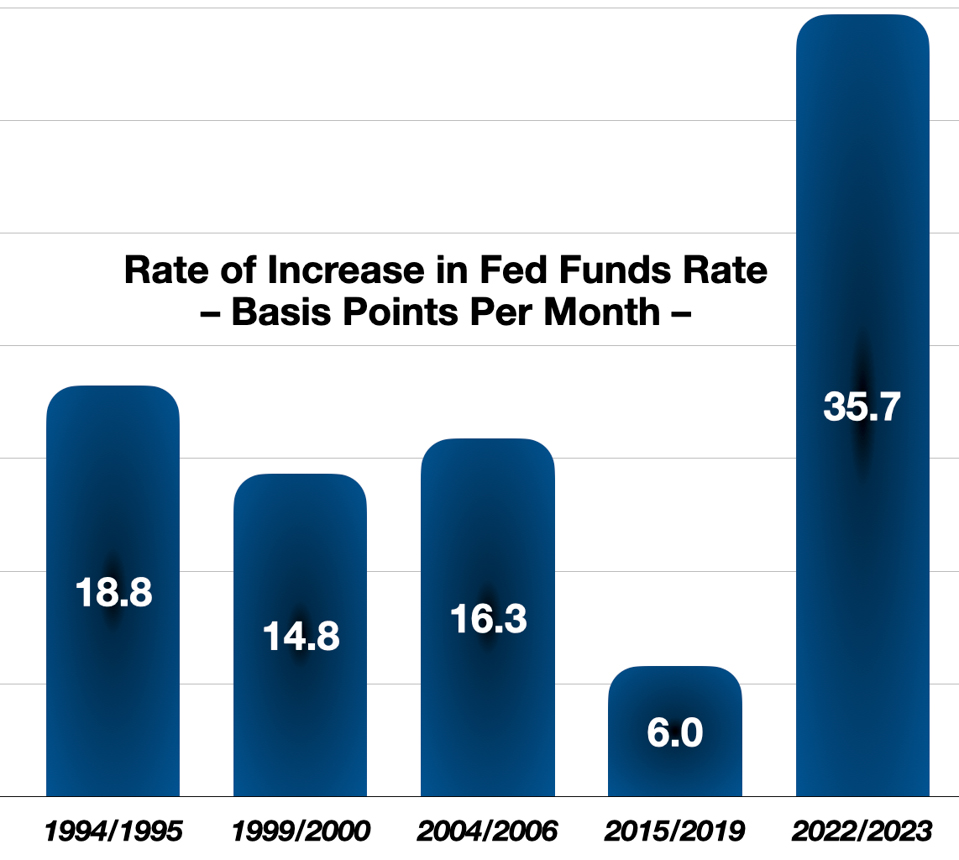
- Rate-hike programs have significant side-effects, especially when they are as aggressive as the current program. The ongoing rate hikes since March 2022 have raised the rate twice as fast per month as any of the previous rate tightening programs.
Accounting for the Collateral Damage
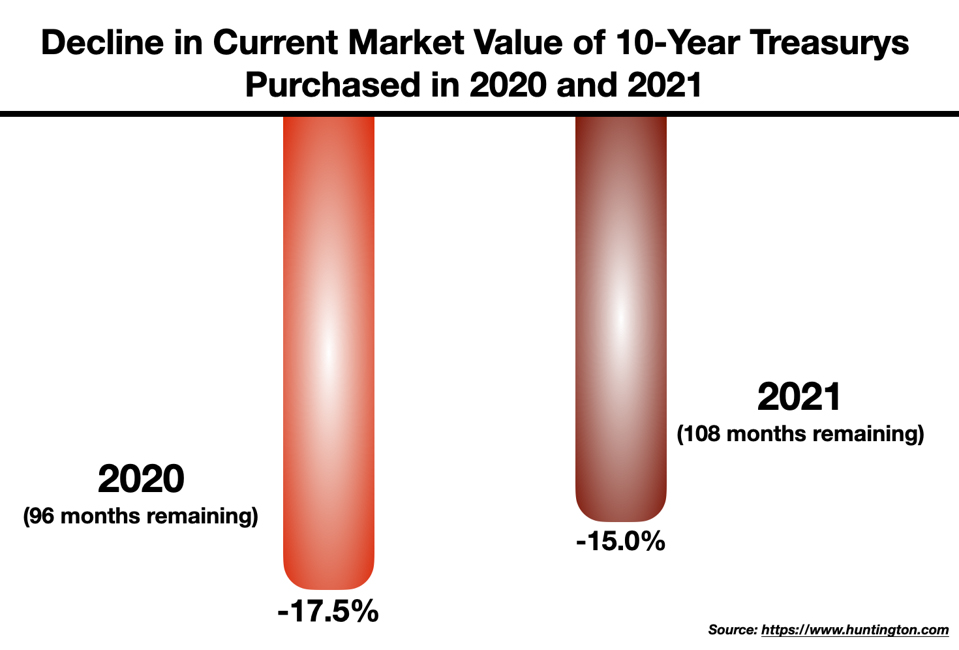
The Fed’s aggressive policy created a shockwave in the fixed income market, which whipped through the banking system (among other sectors). Bond prices fell rapidly by as much as 15% or more, even for the most risk-free categories (Treasurys).
It triggered the collapse of Silicon Valley Bank and First Republic Bank, and put many others under severe pressure. In April the Wall Street Journal reported that
- “The 435 banks in The Wall Street Journal’s sample included 100 where the combined unrealized losses on loans and held-to-maturity securities were equivalent to 50% or more of their total equity.”
In other words, nearly a quarter of the banks the Journal looked at were pushed to the brink.
Even the largest have their wounds to lick. Bank of America is said to have more than $100 billion in paper losses today, directly attributable to being on the wrong side of the Fed rate-hike program. While it does not pose an existential threat to BofA, it will drag down earnings for some time. The bank’s net interest margin has fallen 15% below its arch-rival JP Morgan.
The lessons from this – first, the efficacy of Fed rate policies for the actual reduction of inflation should be examined carefully. The phenomenon is complex, and it is possible (likely) that rate increases do have an important impact on some segments of the CPI (shelter?) and little if any effect on many other segments (energy). The idea that the central bank can just push one button and “tame” inflation is transparently simplistic.
Second, besides its role as an “inflation-tamer,” the Fed is also the steward of the financial system and the safeguard of its stability. It seems fairly clear that no one modeled the ravaging of the bond market and its effects on the banking system that a hyper-aggressive rate-hike program would bring about. This needs to be “factored in” to future rate-setting programs.
See also:
The “Long And Variable Lag” – A Dangerous Monetary Policy Myth
by George Calhoun
Follow me on Twitter or LinkedIn.
About the Author:
Dr. George Calhoun, a graduate of the University of Pennsylvania, received his Doctorate Degree from the Wharton School of Business. He has served in multiple capacities in the Financial Sector and in the Wireless Communication Industry. He has authored multiple articles on subjects of interest to him and several books. His most recent book “Price & Value: A Guide to Equity Market Valuation Metrics” is available through the Publisher Springer/Aspress. Dr. Calhoun currently serves as the Executive Director of the Hanlon Financial Systems Research Center at the Stevens Institute of Technology and is an Advisory Board Member of Hanlon Investment Management.
Vestbridge Advisors, Inc. (“VB”) Is registered with the US Securities and Exchange Commission as a registered investment advisor with principal offices at 3393 Bargaintown Road, Egg Harbor Township, NJ. The information contained in this publication is meant for informational purposes only and does not constitute a direct offer to any individual or entity for the sale of securities or advisory services. Advisory advice is provided to individuals and entities in those states in which VB is authorized to do business. For more detailed information on VB, please visit our website at www.Vestbridge.com and view our Privacy Policy and our ADV2 Disclosure Document that contains relevant information about VB. Although VB is a fairly new organization, any references herein to the experience of the firm and its staff relates to prior experience with affiliated and nonaffiliated entities in similar investment related activities. All statistical information contained herein was believed to be the most current available at the time of the publishing of this publication.