
Dissecting The Consumer Price Index: Inflation Is Over
December 14, 2022
By Dr. George Calhoun
Hanlon Investment Management Advisory Board Member
Executive Director of the Hanlon Financial Systems Center
“Inflation remains far too high. ” — Jerome Powell, Chair of The Federal Reserve (Nov 30)
Inflation is about to become old news. To put it even more forcefully, the post-pandemic bout of rising prices has already come to an end. The upstream segment of the economic pipeline is flashing multiple disinflationary and even deflationary signals. Declining commodity, food and energy prices are leading indicators for lower prices downstream.
Yes, the Consumer Price Index (CPI) is still running hot and scary. The November CPI showed an increase of 7.1% year-over-year. Yikes!
But if there are leading indicators, there are also misleading indicators – and the CPI is a prime example.
Dissecting the CPI
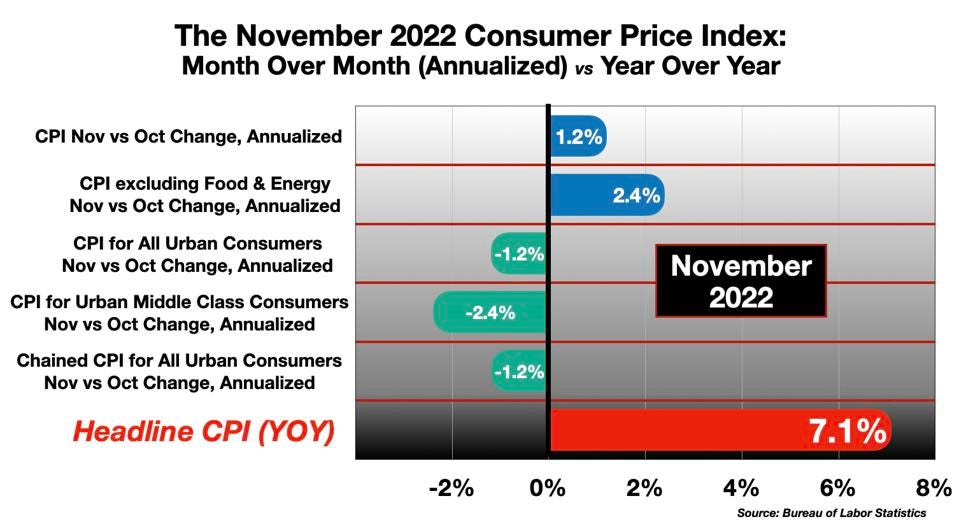
The 7.1% figure dominating the headlines this week is a red herring. It is a backwards-looking calculation comparing November 2022 to November 2021. The actual monthly price rise in November, compared to October, was just 0.1%. On an annual basis, going forward, the current rate of price increases (using the CPI methodology) is something like 1.16%. The Core CPI (excluding food and energy) rose 0.2% month over month in November – 2.4% on an annualized basis. Other versions of the full CPI (all official BLS measures – see chart below) saw actual deflation in November’s month-over-month figures.
This is more than just a one-month anomaly. To see the trend properly, we must dissect the CPI into a more granular time-series.
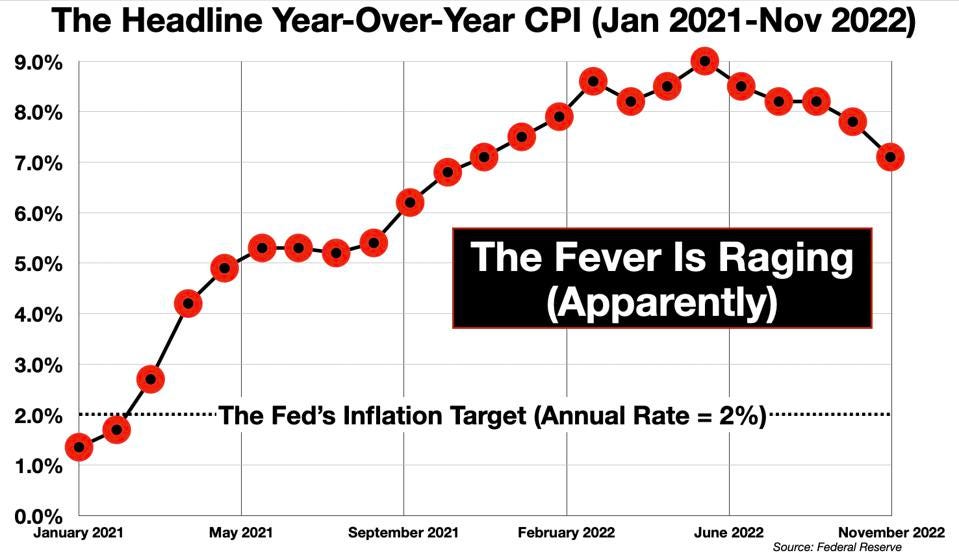
The year-over-year CPI (the “headline number”) portrays inflation as an ongoing phenomenon, only slightly abated in recent months, and still far above the Federal Reserve’s target. This perception is driving aggressive Fed monetary policy actions, and undoubtedly contributing to the inflationary psychology among the general public.
Yet if the current rate of change is plotted – that is, the month-over-month incremental increases – a different picture emerges.
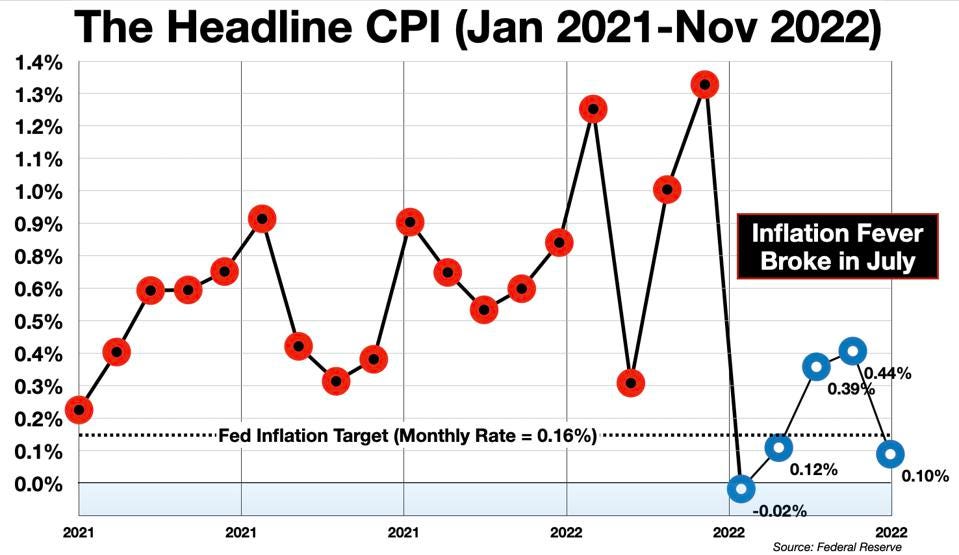
In other words, the headline CPI paints a false picture of raging inflation at a moment when the real-time rate of price increases is essentially zero, or even negative.
Why do we attribute so much psychological importance to this misleading number? Is it because we have always done so? (Inertia is not a very good reason.) Or perhaps it reflects the age-old journalistic maxim that bad news sells papers. (Also, not such a good reason.) Or is it a symptom of groupthink among some professional economists?
The pragmatic question should be: Which number is most relevant for the markets, or for policymakers? A rear-view-mirror comparison with last year? Or a live snap-shot of the current state of affairs?
Any year-over-year calculation is in a sense out-of-date, by definition. To indulge an analogy: The CPI is like a speedometer that tells you how fast you are going today compared to an hour ago, rather than how fast you are going right now.
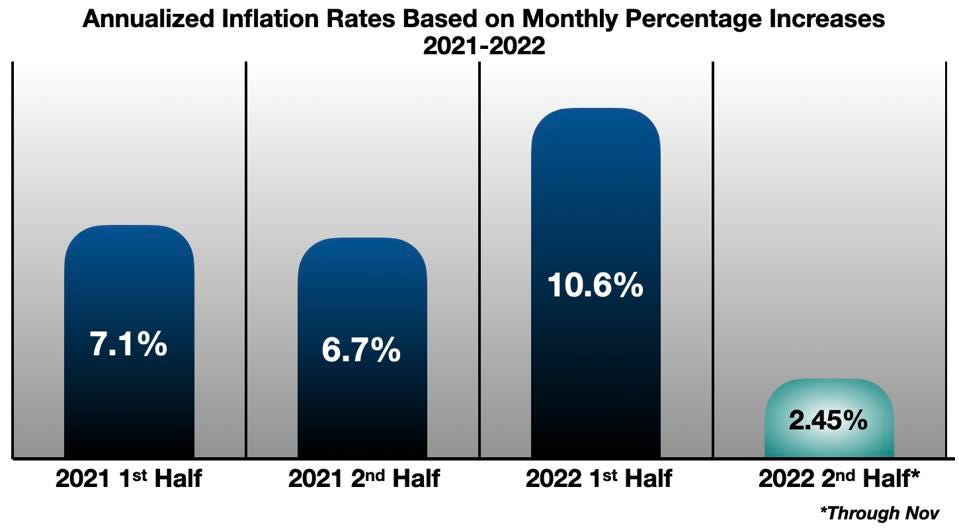
But if an annualized rate is needed, the Federal Reserve offers a better one, multiplying the percentage increase or decrease each month by 12. This time-series shows the realtime acceleration and deceleration of inflation at the annual rate.
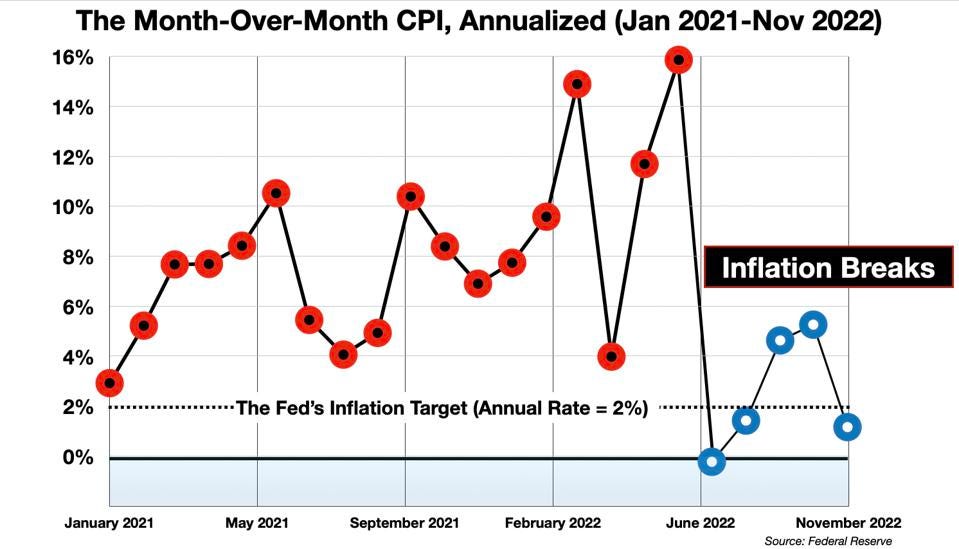
The pattern is clear. The last five months saw an annualized rate of inflation, in real-time, of about 2.4%. That is close to the average of 2.2% for the 4 years prior to the pandemic shock, and only slightly above the Fed’s inflation target of 2%.
Beyond the Headlines
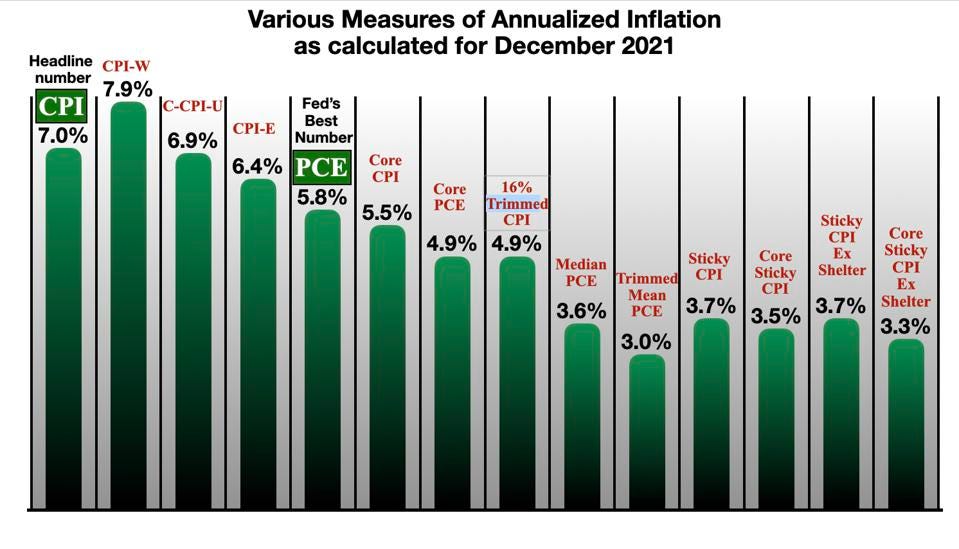
There are many other problems with the headline CPI. It is known to overstate the “true” inflation rate by a significant amount. Some of its flaws have been addressed and partially mitigated by the use of alternative inflation indexes, developed by the Federal Reserve over the years to try to portray a more accurate picture of the economic impact of price trends (covered in a previous column). Because of its known inaccuracies, the Fed long ago removed the CPI from its pedestal, and replaced it with the Personal Consumption Expenditure Index (PCE) – which generally shows a lower inflation reading. In the last 6 months, the PCE has averaged 200 basis point lower than the CPI – 6.5% vs 8.5%.
The CPI is higher than any of the other indexes used by the Federal Reserve and others (e.g., as here, from Dec 2021 – when the post-pandemic surge was well underway).
Averages, and Decisions
Averages obscure the fine structure of the phenomenon subjected to averaging, in two ways. First, they smooth out the ups and downs in the signal, which sometimes contain the most vital information. (One is reminded of the tale of the man who drowned in a river that was just six inches deep, on average.) An engineering-flavored way of saying this is that averages like the CPI miss non-linear changes – when the market regime breaks down, or an economic trend reverses, or some important process (like “inflation”) reaches an inflection point, it is usually an important moment – more important than the intervening periods of predictable continuity. An index structured as a year-over-year backwards-looking measure will miss these moments, or register them only long after they have taken place.
Second, indexes structured like the CPI devalue the importance of the most recent data, which is usually the most relevant for decisions to be taken today. The “latest news” is diluted with a lot of “prior information” that is now well out-of-date. Knowing that a car averaged 30 mph over the last hour is be less useful than knowing that it has been immobile for the last 5 minutes.
In short, averaging destroys the information needed for timing of important decisions – when to invest, to buy or sell, to adjust the model, to change policies.
The media are fooled, apparently, by this. It is hard to tell whether the policy-makers at the Federal Reserve are also fooled. One would expect their training in composing and handling economic statistics would alert them to look beneath the headlines. But Chairman Powell’s recent comments suggest otherwise. Here’s what he said two weeks ago.
- [I] begin by acknowledging the reality that inflation remains far too high… We need to raise interest rates to a level that is sufficiently restrictive to return inflation to 2 percent. There is considerable uncertainty about what rate will be sufficient… we have more ground to cover…. We are tightening in order to slow growth … to restore the balance that will yield stable prices over time. We need to bring inflation down to 2 percent… Despite some promising developments, we have a long way to go in restoring price stability.
These comments are baffling. Powell speaks as though inflation is still raging full on at this moment. But the weather has clearly changed. Since July, the annualized monthly PCE (his personal preference, apparently) has declined by two-thirds compared to the 1st half of 2022. It is now running just slightly above the Fed’s target inflation level.
And yet – the Fed continues to tighten. One day after the November inflation report, the central bank raised its benchmark interest rate yet again.
- “The Federal Reserve on Wednesday raised its benchmark interest rate to the highest level in 15 years, indicating the fight against inflation is not over.”
Summary
The “fight against inflation” is actually over. Done. The Fed just doesn’t appear to realize it. At this point, the Fed seems to be tilting at some windmill of imaginary public opinion. We can expect they will soon claim their quixotic victory, although it may be in the context of an iatrogenic recession. In any case, these interest rate increases look less like effective policy moves and more like merely another lagging indicator.
But these misleading inflation numbers are not harmless fictions. Monetary policy is reacting to stale data. That is dangerous. Its authors have missed the significant change in the inflation regime, now in plain sight, and confirmed over the past five months. Our central bank policies are based on an incorrect understanding of the economic situation, and the consequences may be globally destructive.
Click here to download a copy of advisory.
About the Author:
Dr. George Calhoun, a graduate of the University of Pennsylvania, received his doctorate degree from the Wharton School of Business. He has served in multiple capacities in the Financial Sector and in the Wireless Communication Industry. He has authored multiple articles on subjects of interest to him and several books. His most recent book “Price & Value: A Guide to Equity Market Valuation Metrics” is available through the Publisher Springer/Aspress. Dr. Calhoun currently serves as the Executive Director of the Hanlon Financial Systems Research Center at the Stevens Institute of Technology and is an Advisory Board Member of Hanlon Investment Management.