
2024 2nd Quarter Review
July 8, 2024
Economic Commentary
Hopes for a first-half 2024 rate cut quickly faded during the second quarter as the Fed repeatedly stressed its desire to see more sustained progress on inflation. The good news is that inflation appears to be slowing after a first-quarter scare. The market has gradually come to accept the Fed’s projections of just one rate cut in 2024, as shown in the most recent “Dot Plot” Summary of Economic Projections.
Exhibit 1. Fed “Dot Plot” – March and June Median Forecasts Highlighted
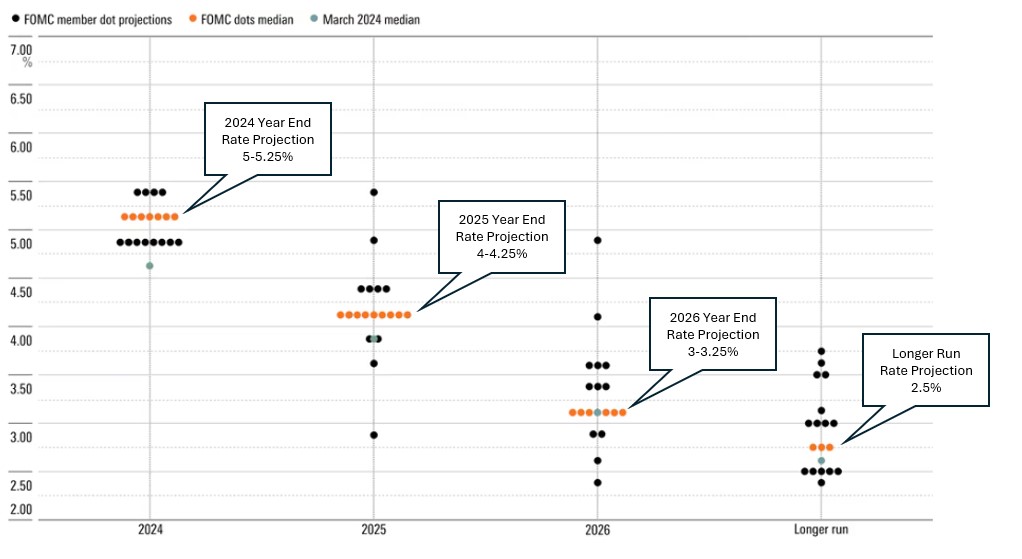
The Fed’s preferred inflation measure, the Core Personal Consumption Expenditures Index (PCE), has eased to an annual rate of 2.7%, still above the 2% target but at its lowest point since early 2021. At this juncture, it looks like September is the earliest possible date for a rate cut, with November being more likely. That sets up for an interesting political dilemma as the Presidential Election is also in November.
The Fed wants to hold off as long as possible so that it can confidently implement multiple successive cuts and minimize the risk of pausing or – worst case scenario – reverting to hikes. Thus far, remaining on pause has been an option because the economy has been strong enough to endure the higher rates without a significant uptick in unemployment. The US unemployment rate is presently at 4.1%, off the lows but still relatively benign. The considerable tightness in employment, however, has abated, which is a good sign for inflation.
US economic output has also remained strong enough to withstand higher borrowing costs. US Real GDP clocked in at 1.4% in Q1 and should come in above 2% in the second quarter. The inflation adjusted GDP, known as nominal GDP, came in much higher at 5.4%. While consumers appear to be cutting back in some areas, they have continued to spend on services, travel, and leisure.
Market Commentary
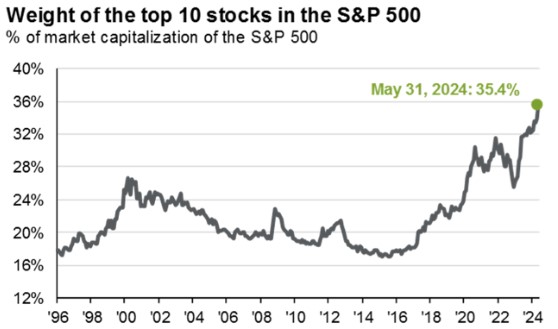
The S&P 500 pulled back a little over 5% at the start of the second quarter, but strong corporate earnings brought buyers back in and the losses were quickly erased. The S&P 500 returned 4.3% in the second quarter, while the Nasdaq gained 8.3%. The theme from 2023 of mega-cap tech dominance has persisted, which has pushed the market capitalizations of the largest 10 stocks in the S&P 500 to their largest proportion on record at over 35% of the index value.
Exhibit 2. Market Cap Weight of Top 10 S&P 500 Stocks
US Large Cap are expected to grow earnings at 11.3% in 2024 and 14.4% in 2025. This earnings growth has the Price-to-Earnings multiple for the S&P 500 at 20.8 times forward earnings despite the run-up in shares. Corporations have also bolstered efficiency, increasing average corporate profit margins to nearly 18%. The strongest earnings growth has unsurprisingly come from the Technology sector, as companies with Artificial Intelligence (AI) exposure have seen their investments in the new technology pay off in the form of blowout earnings beats.
While the Technology sector was the best performer in the quarter, gaining 8.8%, AI has the potential to generate efficiencies across all industries as more companies find business uses for the rapidly evolving technology. We believe there is a clear distinction between the present AI boom and the dot-com bubble/bust of the past. The companies at the forefront of AI are large, established firms that are already turning technology into profits. This is a sharp contrast from the unprofitable start-ups that were the source of the dot-com bubble/bust.
Outside of large cap stocks, investors in US small and mid-caps were disappointed with the Fed’s delayed timeline for rate cuts, and these two asset classes underperformed due to their higher sensitivity to interest rates. Despite the setback, we still view US small and mid-caps as investable for the remainder of the year in anticipation of lower rates. As we saw in November 2023, when the interest rate narrative shifts, US small and mid-cap stocks can see rapid price appreciation.
US stocks have led the way on the global stage for some time, and that trend continued in the second quarter. Developed International stocks lagged US with a negative return during the quarter for the MSCI EAFE Index, which lost -0.2%. Japanese equities had carried the EAFE index in 2023 and through the first quarter 2024, but a severe decline in the Yen has raised concerns that costly imports could impair Japanese economic growth, outweighing the benefits of a weaker Yen for Japanese exporters. The Eurozone economy has a chance to outperform in the second half of the year, however, since the European Central Bank (ECB) has a head start on the US Federal Reserve in cutting rates, having already implemented its first cut. Eurozone inflation is lower than that of the US, and foreign stocks trade at lower multiples, so there could be some incentive for investors to move money out of frothy US markets and into European markets/stocks as the ECB attempts to spur growth.
Exhibit 3. S&P 500 (SPY), MSCI EAFE (EFA), and MSCI Emerging Market (EEM) Q2 Performance
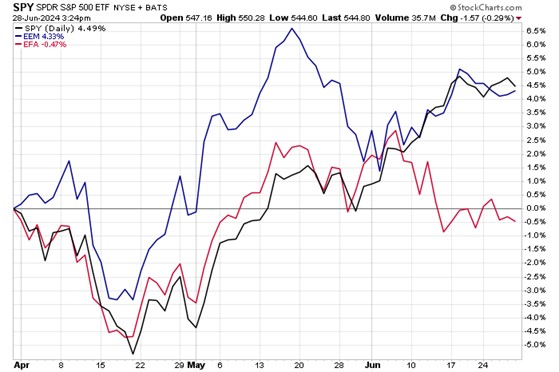
Emerging Market (EM) stocks gained 4.4% during the quarter, despite persistent challenges for the largest EM constituent, China. In addition to its troubled property sector and the associated bankruptcies stemming from its “shadow banking” system, China has found itself in the US crosshairs in a semiconductor war. US attempts to protect sensitive technology that powers AI and other technology applications has resulted in regulatory restrictions on exports of chips to China and has exacerbated the onshoring/reshoring trend as companies seek to distance themselves from the unpredictable Chinese regime.
Fixed income investors saw rates rise slightly at the beginning of the quarter only to ease back down and end relatively unchanged. The 10-Year Treasury yield ended the quarter at 4.35% and will likely remain range-bound until the Fed provides more clarity on interest rate policy. Short-term Treasuries, which we have advocated for and hold in our tactical models, remain the highest yielding segment of the US Treasury yield curve. Corporate High Yield bonds showed resilience in the quarter, gaining 0.7% as defaults remained low, and their yields remain near higher single digit levels.
Closing Remarks
While it is somewhat disappointing that the timeline for rate cuts has been pushed back, investors can take solace that stocks have mostly shrugged off the Fed’s delay and instead embraced strong corporate earnings and the prospects of continued growing economic output. We are pleased with the resiliency that markets have demonstrated in the first half, already eclipsing most Wall Street banks’ initial year-end targets. With the rate-cut boost still in play for late 2024, and into 2025, we believe the runway is clear for the “soft landing” but we will remain attentive and nimble as always.
Thank you, as always, for the opportunity to serve you.
Vestbridge Advisors, Inc. (“VB”) Is registered with the US Securities and Exchange Commission as a registered investment advisor with principal offices at 3393 Bargaintown Road, Egg Harbor Township, NJ. The information contained in this publication is meant for informational purposes only and does not constitute a direct offer to any individual or entity for the sale of securities or advisory services. Advisory advice is provided to individuals and entities in those states in which VB is authorized to do business. For more detailed information on VB, please visit our website at www.Vestbridge.com and view our Privacy Policy and our ADV2 Disclosure Document that contains relevant information about VB. Although VB is a fairly new organization, any references herein to the experience of the firm and its staff relates to prior experience with affiliated and nonaffiliated entities in similar investment related activities. All statistical information contained herein was believed to be the most current available at the time of the publishing of this publication.