
Will Housing Save The Day?
March 16, 2023
The recent banking crisis has immediately lowered expectations for future inflation expectations and interest rate hikes. Why? There is a direct correlation between economic activity and loan volume, and loan volume is destined for a short term contraction, at a minimum, as the regional banks, and even the big money center banks, reassess their positions and await whatever revised government regulation comes out of this banking crisis. So the economy will slow, even more than recently predicted, and that should produce lower inflation. Perversely, this banking crisis may have been just what the Fed needed to help it reduce inflation.
Housing remains the main event as to this year’s inflation flight path.
Watching monthly inflation releases has become something of an American pastime over the past year, with the acronyms CPI, PPI, and PCE (Consumer Price Index, Producer Price Index, and Personal Consumption Expenditures for the uninitiated) no longer relegated to discussions among economists and now familiar to most of the general investing public. With the Federal Reserve stressing its “data-driven” approach to containing inflation, investors are desperately scanning each data release for signs that the Fed’s aggressive rate hikes are taking effect and slowing down out-of-control inflationary price pressures.
While things were looking good for a few months, the most recent data releases have failed to inspire confidence that the Fed has a handle on inflation. Producer Prices, charged by manufacturers, wholesalers, and farmers, were down in December, up in January, and then down again in February. Prices paid by consumers has been stickier, with CPI rising 0.5% in January and 0.4% in February. Even when stripping out the volatile food and energy categories, so-called “core” CPI was up 0.4% in January and 0.5% in February. These hot inflation readings were backed up by the Fed’s preferred inflation gauge, PCE, which showed an uptick of 0.6% in January on both the headline and core reading. Annually, core inflation is either 5.5% or 4.7%, using core CPI or core PCE, respectively.
No matter which metric you use – CPI, PPI, PCE, headline or core – inflation is running hot, and the Fed rate hikes have been ineffective. Wage growth and demand for services has kept the Fed’s 2% inflation target far out of reach. The Fed has little recourse but to keep pounding rate hikes and desperately hoping that eventually higher borrowing costs will change consumer behavior. Perhaps their best chance lies in the housing market, and a reduction in the “shelter” component of inflation readings.
At this point, we should examine the differences between the CPI and PCE inflation measures, as the former is typically the most widely followed but the latter is the yardstick the Fed is using. When the Fed references inflation, it is talking about Core PCE, that is PCE ex-food and energy. Core CPI and Core PCE contain similar components, but the way they weight them differs significantly, as shown in the below pie charts.
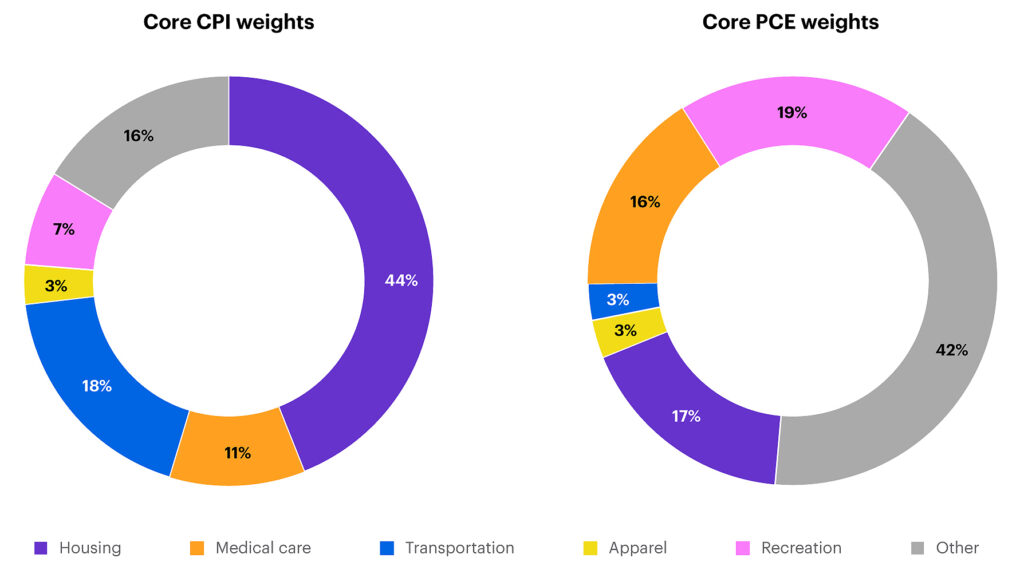
The most glaring difference between the two is the relative overweight in CPI to Housing, and the overweight to the nebulous “Other” category in PCE, but there are other significant differences in categories such as transportation and recreation. Why do the two differ so much, and why does the Fed favor PCE over CPI?
CPI is compiled by the Bureau of Labor Statistics using household surveys, and covers only out-of-pocket expenditures, excluding indirect payments such medical care covered by employer-provided insurance, Medicare or Medicaid. CPI data is also limited to only urban households. PCE data comes from the Bureau of Economic Analysis, is pulled directly from US GDP and supplier data, and covers all US households and nonprofits, extending beyond the urban sample used in CPI. PCE also has more flexibility to substitute goods and services as consumer behaviors shift. For example, if the cost of bread increased enough to deter consumers from purchasing bread, PCE could substitute an alternative basket of goods while CPI would not account for the shift in consumer preferences. This flexibility, along with a broader sampling of goods and services, makes PCE the Fed’s preferred inflation metric.
Despite these differences, housing plays a major role in both CPI and PCE, particularly the former at 44% of the core calculation. Like other components of inflation, housing inflation has been running hot at 8.1% in CPI and 5.8% in PCE. Housing inflation accounts for both homeowners and renters, and while PCE and CPI calculations differ, both rely on survey-based data that has some unique shortcomings.
Fed Chairman Jerome Powell addressed these shortcomings at a Brookings Institution speech in November, stating “Housing inflation tends to lag other prices around inflation turning points, however, because of the slow rate at which the stock of rental leases turns over. The market rate on new leases is a timelier indicator of where overall housing inflation will go over the next year or so. Measures of 12-month inflation in new leases rose to nearly 20 percent during the pandemic but have been falling sharply since about midyear [2022].”
Powell is correct in pointing out that the survey-based approach, in which rental costs are sampled every six months via survey, can result in significantly lagging data, exacerbated by the fact that most leases are annual and therefore price inflation is locked in for 12 months. The inflation experienced by homeowners, known as “owner’s equivalent rent” (OER) is also subject to similar lag, as it is survey-based as well. Some economists, aware of the lagging nature of housing inflation data, have turned to alternative measures such as indices published by Zillow, RedFin, and the National Association of Realtors. These timelier measures show that home prices may have turned the corner, although they remain inflated relative to pre-pandemic levels, particularly in regional markets where wealthier buyers can afford to forgo a mortgage and pay in cash.
Real-time data on rental costs is also trending positive. While ApartmentList.com’s National Rent Index increased 0.3% in February, the uptick followed five consecutive monthly declines and can be attributed to seasonality. The index’s year-over-year rent growth has fallen to its lowest level since April 2021 at 3.0%. So, we may see the official housing inflation data eventually catch up to these timelier measures, although that moment may remain several months away.
The biggest challenge to housing inflation remains a severe supply shortage spurred by a decline in construction during the pandemic. There should be some relief on the way in the form of a multifamily home construction boom, which has reached a new all-time high.
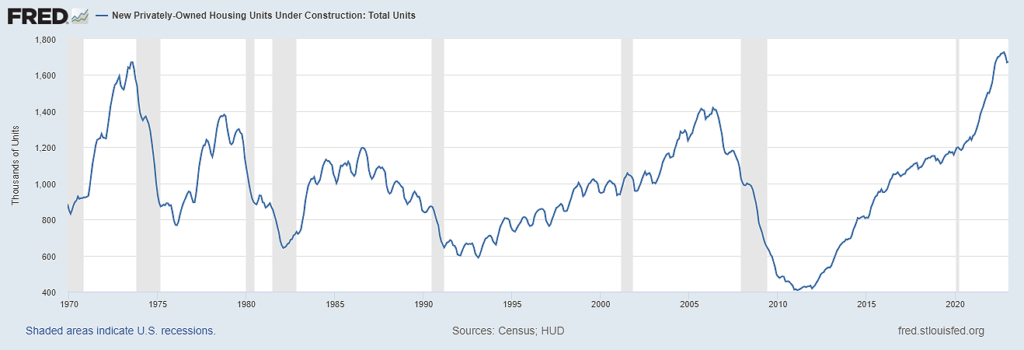
The shift to multifamily construction adds a bit more lag to the housing recovery, however, as the average completion time for a multifamily unit takes roughly fifteen months compared to seven months for a single-family home.
When the combined impact of updated survey data and increased supply finally shows up in official inflation measures, we could see a material downward shift in overall inflation. CPI will likely reflect a larger downward move from housing inflation relief than PCE, but both measures will benefit from the delayed deflationary pressures. While the Fed uses PCE as its measuring stick, it often cites CPI data in its decision-making process and therefore a housing-induced decline in CPI may factor into upcoming rate hike decisions as well.
The Fed knows that housing inflation will be dropping off sometime this year, but it is still unclear if they will delay rate hikes based on expectations of incoming data, or be pressured by trailing data to push rates up more aggressively. Recent banking sector turmoil may have provided the Fed with an “out” to slow or pause rate hikes, and hope that the housing data comes in as anticipated. Analyzing the Fed’s upcoming dot plot projections, and their policy announcement statement and press conference comments will be crucial to determine how the Fed plans to account for housing market relief that may still be many months away.
Thank you, as always, for the opportunity to serve you.
Vestbridge Advisors, Inc. (“VB”) Is registered with the US Securities and Exchange Commission as a registered investment advisor with principal offices at 3393 Bargaintown Road, Egg Harbor Township, NJ. The information contained in this publication is meant for informational purposes only and does not constitute a direct offer to any individual or entity for the sale of securities or advisory services. Advisory advice is provided to individuals and entities in those states in which VB is authorized to do business. For more detailed information on VB, please visit our website at www.Vestbridge.com and view our Privacy Policy and our ADV2 Disclosure Document that contains relevant information about VB. Although VB is a fairly new organization, any references herein to the experience of the firm and its staff relates to prior experience with affiliated and nonaffiliated entities in similar investment related activities. All statistical information contained herein was believed to be the most current available at the time of the publishing of this publication.