
Time for the Little Guys

July 25, 2023
Roughly two months ago, we noted that there was a bit of an anomaly taking place in the markets, with major indices moving higher despite negative breadth (See our June 2nd Forbes Commentary here). In May, stock indices were being pushed higher despite most of the component stocks trending downwards, because the overwhelmingly dominant size of the mega-caps allowed them to control the overall market direction. The S&P 500’s market cap skews heavily towards a handful of stocks in three sectors; Apple (AAPL), Microsoft (MSFT), and Nvidia (NVDA) in the Technology sector, Google (GOOG) and Meta (META) in the Communication Services Sector, and Amazon (AMZN) AND Tesla (TSLA) in the Consumer Discretionary sector. These seven names encompass nearly 28% of the overall S&P 500 market cap, near a modern-day record for concentrated stock weights in the S&P 500 Index.
In the table below, we can see how despite only three sectors being positive in May and the rest down, the overall S&P 500 still managed to close out the month of May 0.43% higher. We cautioned that for the market to truly break out to a sustainable bull run, participation would need to broaden out beyond mega-cap stocks and into other sectors and stocks bought less so far in this rally. We suggested that it may be time to add exposure to areas of the market beyond the “big three” sectors of Tech, Communications, and Consumer Discretionary.
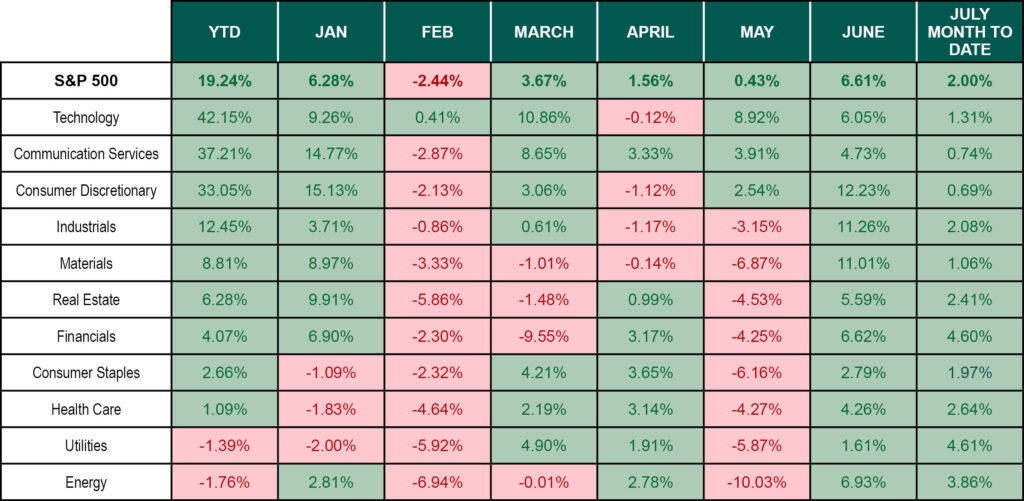
Looking at the returns from June shows how the rally extended beyond the mega-caps and market breadth improved tremendously. The result was the best monthly return for the S&P 500 year-to-date.
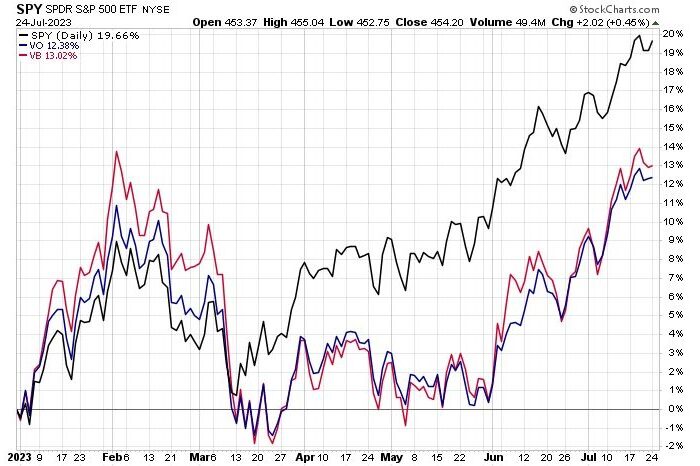
Looking at the returns from June shows how the rally extended beyond the mega-caps and market breadth improved tremendously. The result was the best monthly return for the S&P 500 year-to-date. With this positive development, we now look beyond the S&P 500’s large cap holdings towards the smaller market cap names in the mid and small cap indices. Below is a chart of the SPDR S&P 500 ETF (SPY, Black Line) compared to the Vanguard Mid (VO, Blue Line) and Small Cap (VB, Red Line) ETFs. We can see that SPY has outpaced the Mid and Small caps in the first half of the year.
2023 Chart of the S&P 500 Index and Small and Midcap stocks
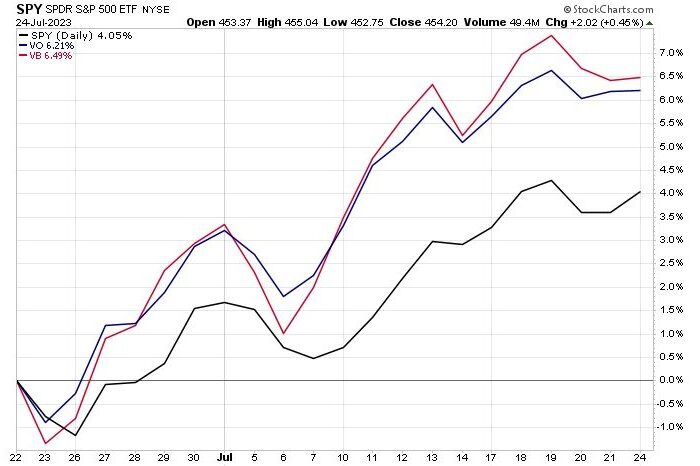
The one-month view, however, paints a different picture. SPY has continued to advance, but VO and VB have taken a leadership role for the time being, with accelerating momentum over the past several weeks. This expansion of market breadth into the mid and smallest market cap stocks is very encouraging as we look for signs of a sustainable bull market rally in the second half of the year.
Ultimately, we need to get data that supports these moves in the form of positive earnings and perhaps more importantly, easing inflation. We are early in the second quarter earnings season, but the results thus far have been solid, especially from the Regional Banks that are heavily weighted within the Small and Mid-Cap indices. From a price momentum and market breadth perspective, the market is clearly trending in the right direction. As the mantra of technical analysts goes, “the trend is your friend”.
Read the Forbes article – Here
Vestbridge Advisors, Inc. (“VB”) Is registered with the US Securities and Exchange Commission as a registered investment advisor with principal offices at 3393 Bargaintown Road, Egg Harbor Township, NJ. The information contained in this publication is meant for informational purposes only and does not constitute a direct offer to any individual or entity for the sale of securities or advisory services. Advisory advice is provided to individuals and entities in those states in which VB is authorized to do business. For more detailed information on VB, please visit our website at www.Vestbridge.com and view our Privacy Policy and our ADV2 Disclosure Document that contains relevant information about VB. Although VB is a fairly new organization, any references herein to the experience of the firm and its staff relates to prior experience with affiliated and nonaffiliated entities in similar investment related activities. All statistical information contained herein was believed to be the most current available at the time of the publishing of this publication.