
2023 3rd Quarter Review
October 5, 2023
Economic Commentary
Market expectations have shifted to embrace the “soft economic landing” narrative, however the economic strength that has postponed a recession has also given the Federal Reserve (the “Fed”) leeway to keep interest rates elevated for a longer period. The economy is holding up better than expected, with GDP growth clocking in at an annual rate of 2.1% in the second quarter and possibly rising as high as 4.9% in the third quarter, per the Atlanta Fed’s GDPNow model.
While a strong economy and persistently low unemployment sound like desirable conditions, they have been obstacles in the Fed’s fight against inflation because growth has largely been driven by consumer spending. While inflation data suggests progress is being made, prices for goods and services are still increasing, albeit at a slower pace. The Fed’s preferred inflation measure, the Core Personal Consumption Expenditure (Core PCE) index, fell to 3.9% year-over-year and was up just 0.1% for the month in August. Of course, the Core PCE index excludes food and energy, which are major real-life costs for households. The broader headline PCE reading was 3.5% annually and 0.4% higher in August, reflecting higher energy prices.
Getting inflation down may take some time, with the Fed itself projecting a 2026 timeline for its 2% target. Investors are now coming to terms with a scenario where the Fed finishes hiking this year as expected but then holds rates higher for longer. The most recent Fed Dot Plot shows a median 5.1% rate projected for year-end 2024, only slightly lower than the current 5.25-5.5% Federal Funds Rate.
Exhibit 1. Change in Federal Open Market Committee Median Interest Rate Projections
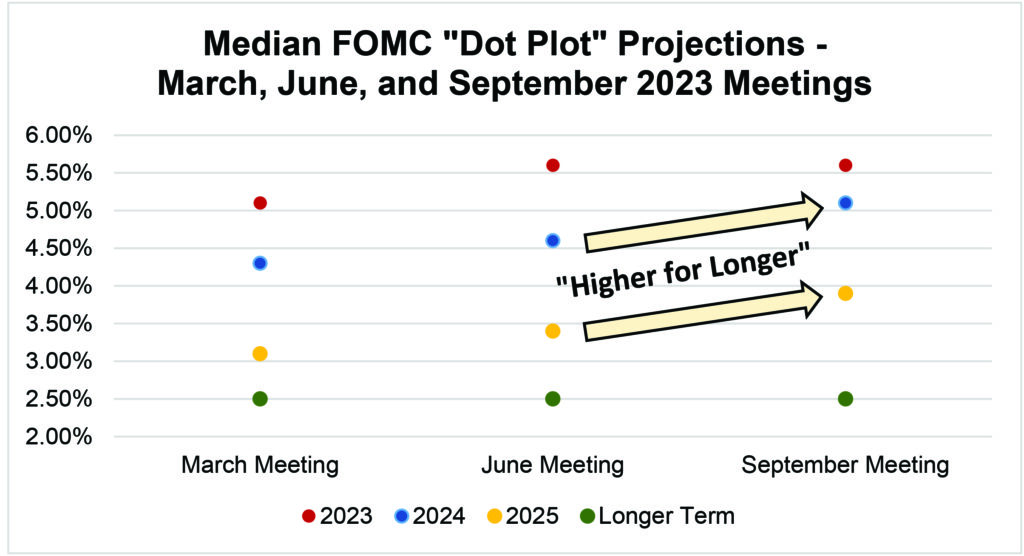
The question now is how long will consumers continue to carry the economy, and will the burden of higher interest rates cause something to break, triggering the recession that we have thus far avoided? Consumer spending has been bolstered by higher wages, a product of low unemployment. The resumption of student loan payments starting October 1st is projected to curtail some of that spending, as should the higher interest costs of auto loans, new mortgages, and credit card debt. Thus far, though, American consumers don’t appear to be in imminent danger, with household net worth rising 3.7% to a record $154 trillion in the second quarter.
The bigger risks of something “breaking” are likely tied to the financial sector, as we saw in the spring as higher rates exposed duration risk mismanagement at regional banks. While the Fed sprang to the rescue with liquidity facilities after several large regional bank failures, many of the surviving banks are still saddled with long-term bonds that are rapidly losing value as the long-dated end of the yield curve has risen steeply in recent weeks. Those banks also hold most of the outstanding commercial real estate loans at a time when commercial vacancy rates now exceed the highs of the Global Financial Crisis at 16.4%. While recent history tells us that the Fed would likely bail out the banking sector, there could be more failures and panic before that intervention occurs.
Market Commentary
Markets entered the third quarter amid an impressive rally, largely attributable to the group of mega-caps that garnered the nickname “the magnificent seven” (AAPL, AMZN, GOOG, META, MSFT, NVDA, TSLA). Year-to-date through September 30th, the S&P 500 was up 13.1% and the contribution from these seven stocks was around 11% of that 13.1%, meaning that 84% of the S&P 500’s return was attributable to just seven stocks. The actual attribution is arguably even higher, considering that the 8th largest holding, Berkshire Hathaway, is comprised of roughly 50% AAPL stock.
The lack of market breadth, where not all stocks participate in the rally, has been a consistent theme all year, leading the equal-weight S&P 500 (represented by the Invesco ETF, RSP) to significantly underperform the traditional market-cap weighted index (represented by the SPDR ETF, SPY, on the below chart).
Exhibit 2. SPDR S&P 500 ETF (SPY) vs. Invesco Equal-Weight S&P 500 ETF (RSP)
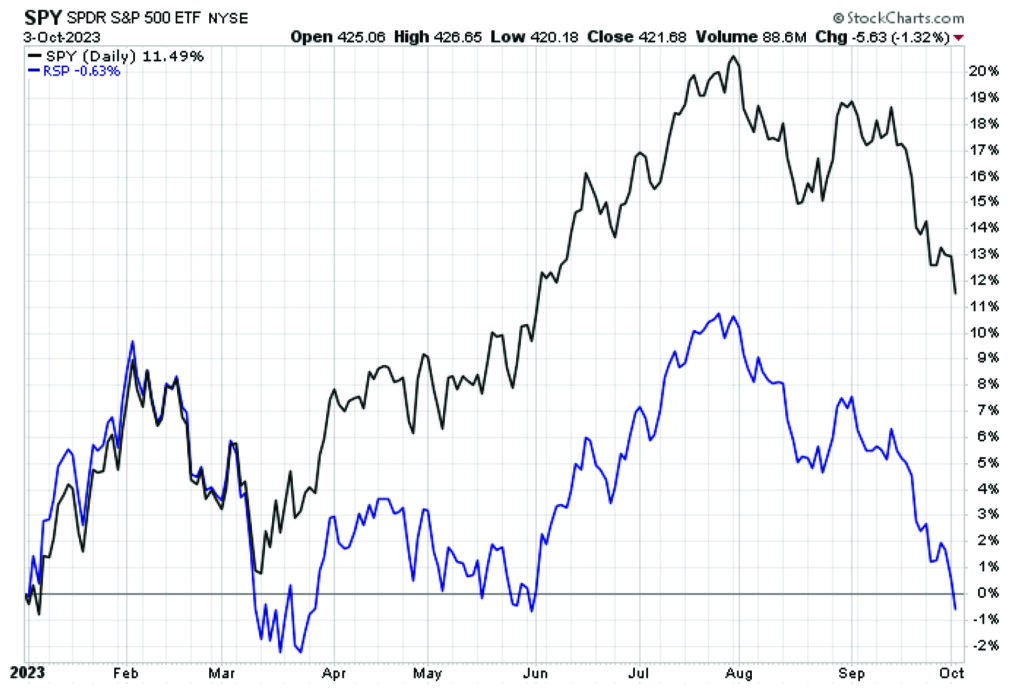
Breaking down quarterly performance among the 11 economic sectors, Energy was the clear winner with a 12.2% return as OPEC oil cuts pushed crude prices to over $90 a barrel. The only other sector with a positive quarterly return was Communication Services, which gained 1.0%. Utilities were the biggest loser, followed closely by Real Estate, down -9.2% and -8.9%, respectively. Both sectors are typically sought after for income given their high dividend payout rates, but with Treasury bonds offering 5% or more risk free, equity dividends have fallen sharply out of favor. It is notable that from a market-cap weighted basis, Utilities and Real Estate are two of the smallest sectors, therefore having the least impact of all the sectors on the overall performance of the S&P 500 Index.
From a valuation perspective, the September pullback in equities has brought the S&P 500 Price-to-Earnings (P/E) ratio down to 17.8 times forward earnings, which would be a fair valuation if a recession is avoided. The P/E ratio for Small Cap stocks looks very attractive at just 12.1 times forward earnings, although smaller stocks are more vulnerable to higher rates due to their relatively higher cost of borrowing compared to their larger peers. For long-term investors, however, owning Small Caps will likely pay off in the years to come.
Fixed income markets are facing their third consecutive year of losses, as measured by the Bloomberg Aggregate Bond Index, the proxy for broad intermediate-term fixed income. For investors in long-term Treasuries, 2023 has been a challenge. Losses on the iShares 20 Plus Year Treasury Bond ETF (TLT) are over -12% on a total return basis (including dividends). The result of the Fed’s rate hikes is a -16% three-year total return for AGG and a -44% total return loss for TLT. Investors trying to time the top on the Fed’s rate hikes have only seen their losses mount as the Fed reiterates its plan to keep interest rates elevated. We have advocated to our clients to keep their maturities away from the long end of the bond market for the past two years.
Exhibit 3. Three-Year Performance of Intermediate and Long-Term Bonds (using AGG and TLT)
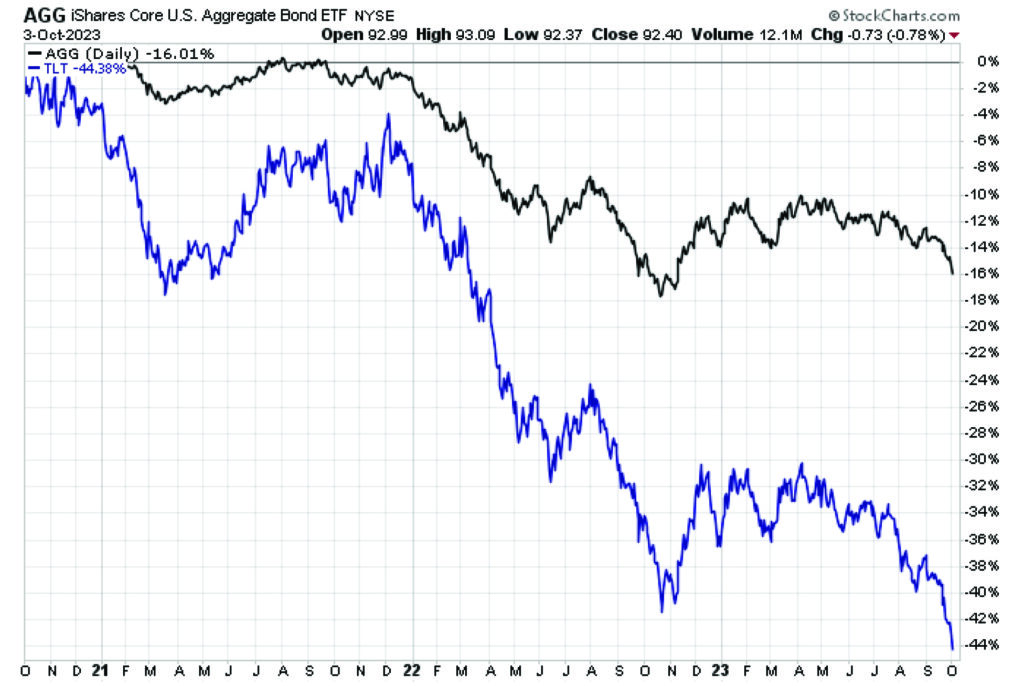
Our preference has been, and remains, owning the shorter end of the yield curve which remains the highest yielding segment with six-month Treasury yields over 5.5%. There will eventually be an entry point to lock in higher rates on long-term debt, but presently there is a significant risk that yields on long-term bonds will break out to the upside from current levels in the near term.
High yield bonds provided positive returns in the first half of the year but became less attractive in the third quarter, primarily due to the rise in risk-free rates as a viable alternative for fixed-income investors. Spreads, which measure the risk premium over risk-free Treasuries, have been relatively low all year but have begun to widen. If banks begin to tighten lending standards due to interest rate pressure, high yield will be under additional pressure.
Closing Remarks
After an unexpectedly strong first half driven by a concentrated cohort of stocks rather than the broader market, a pullback was somewhat expected. Keeping rates “higher for longer” means that stocks have real competition from bonds for the first time in years. Faced with a risk-free alternative yielding over 5%, investors are demanding a higher equity risk premium to own stocks. This aversion to risk could potentially translate to more downside for stocks, even if recession is avoided. Now more than ever, a flexible approach to asset allocation seems warranted as we wait out the near-term volatility. Soon, we shall see if the Fed can follow through with its plan to keep rates pinned higher.
Thank you, as always, for the opportunity to serve you.
Vestbridge Advisors, Inc. (“VB”) Is registered with the US Securities and Exchange Commission as a registered investment advisor with principal offices at 3393 Bargaintown Road, Egg Harbor Township, NJ. The information contained in this publication is meant for informational purposes only and does not constitute a direct offer to any individual or entity for the sale of securities or advisory services. Advisory advice is provided to individuals and entities in those states in which VB is authorized to do business. For more detailed information on VB, please visit our website at www.Vestbridge.com and view our Privacy Policy and our ADV2 Disclosure Document that contains relevant information about VB. Although VB is a fairly new organization, any references herein to the experience of the firm and its staff relates to prior experience with affiliated and nonaffiliated entities in similar investment related activities. All statistical information contained herein was believed to be the most current available at the time of the publishing of this publication.