
The Trend Is Your Friend
Wall Street is the land of clichés and mathematical repetition. One of the cliché’s is “the trend is your friend”. What it means is that trends, such as price patterns, tend to continue. A mathematical repetition is “mean reversion”, where for example stock prices temporarily get overvalued and revert to an average.
The pandemic-driven stimulus measures pushed stocks to record highs that proved unsustainable. The combination of pent-up spending and supply chain scarcity caused many corporations to overestimate demand and underestimate the looming inflationary storm that markets are currently discounting. Third quarter earnings are mostly released. Always drawing attraction are the tech earnings. This quarter they were mixed, with some disappointing, and their stocks have taken unusual hits. Investors are closely watching results as well as forward guidance for clues that will indicate whether the market has bottomed or if we are in for another leg down to new lows.
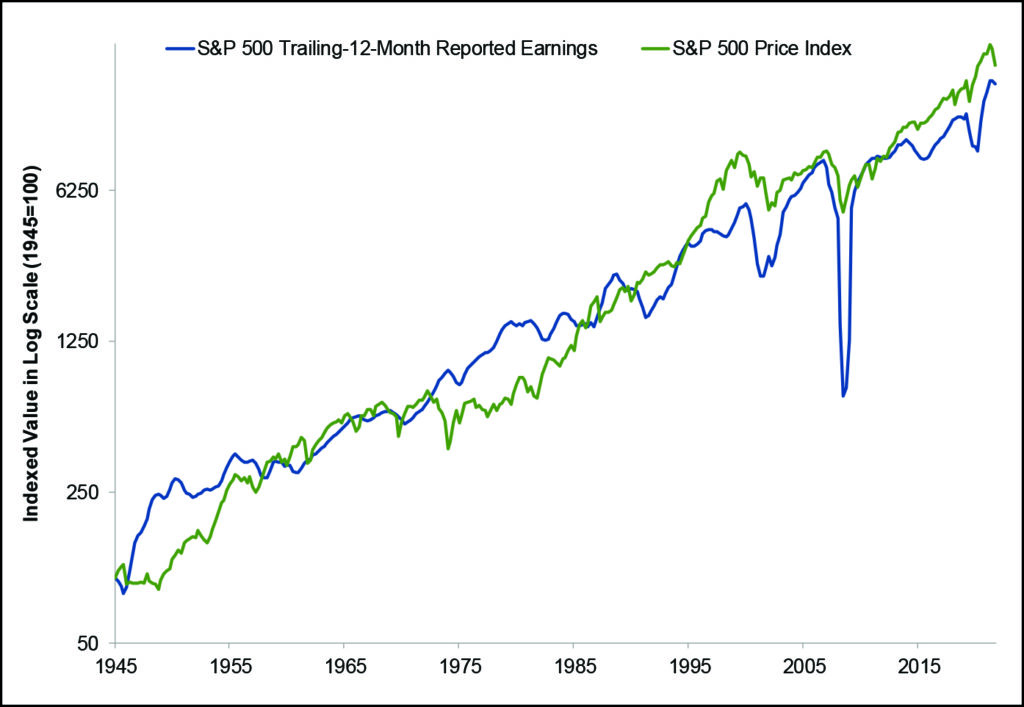
With the S&P 500 Index and Nasdaq Composite down roughly 20% and 30% from their respective highs, investors are struggling to determine what level brings us back to our “normal” long-term growth. For tactical investors who shored up their defensive reserves as markets rolled over, knowing if markets have returned to a semblance of normalcy (not necessarily pinpointing the bottom) is crucial in deciding when to redeploy cash back into markets. For long-term strategic investors, it is also a worthwhile exercise, to perhaps increase dollar-cost-averaging contributions, or to rebalance to asset classes that were oversold relative to the broader market. How then do we decide when the market price is back to “normal”? One way is to look at the price of the S&P 500 relative to its constituent earnings, reflected in the Price-to-Earnings (P/E) ratio. As the below chart shows, the value of the market (price) generally follows the same path as earnings. Reported earnings are of course a trailing measure so at various times the market will be over or undervalued as investors are paying for estimated future earnings. For the long-term the market has traded around an average of a 15 P/E.
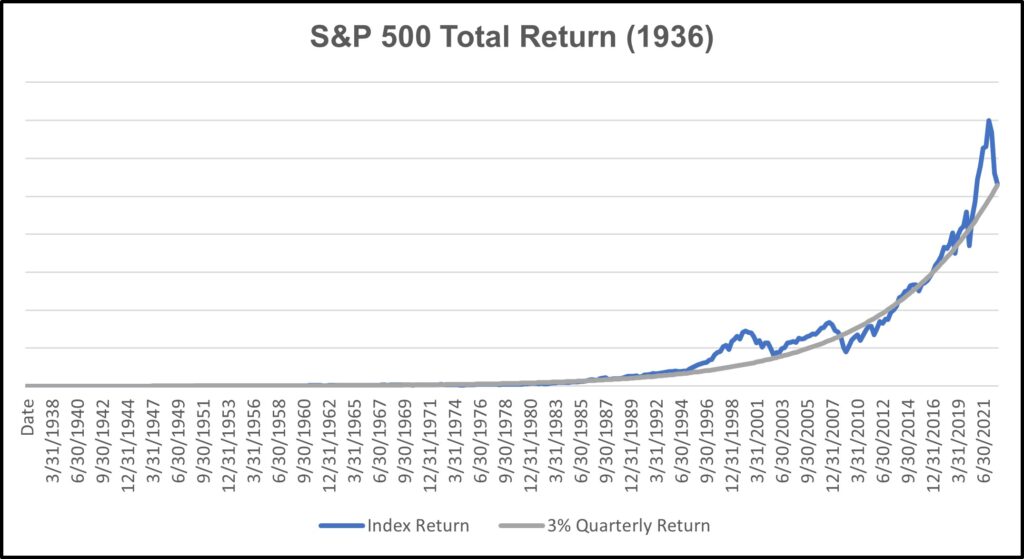
Aside from price-to-earnings metrics, which suggest today we are close to the long-term historical average “fair value”, we can look at a simple chart of the S&P 500 vs its average, or mean, total return to determine where the market stands relative to long-term trend. We know markets were overextended post-Covid, so we are looking for signs of a reversion to the mean. Looking at the S&P 500 Index back to 1936 using quarterly return data (including dividends), we can observe that the quarterly return on it has historically averaged below, but near, 3% per quarter. Plotting this as a steady return series against the actual S&P 500 performance shows the extent of the post-pandemic overvaluation relative to the average return.
This data is somewhat skewed however, due to the exponential growth of the S&P 500. To get a better sense of how far we strayed from the mean return, we can observe the same data on a logarithmic scale, as shown below.
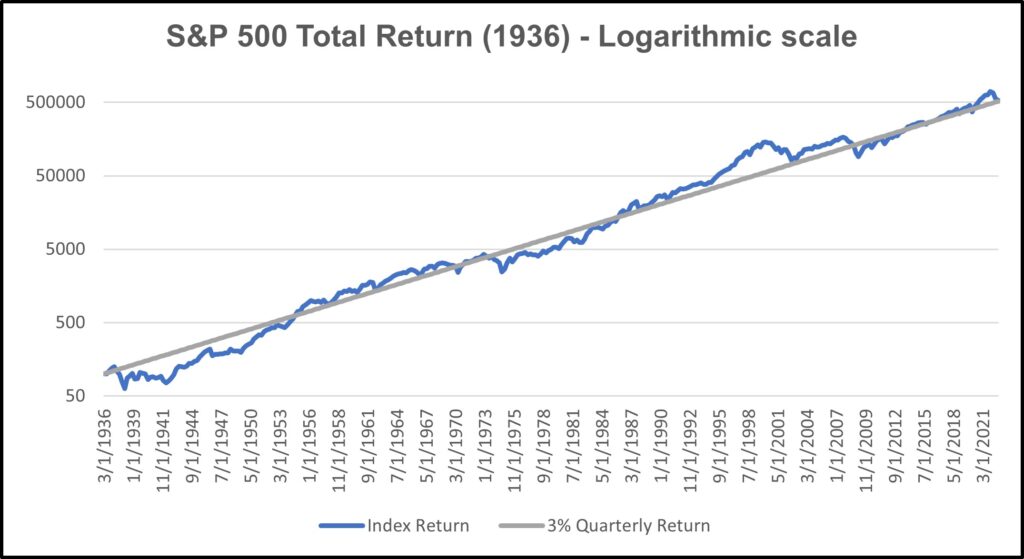
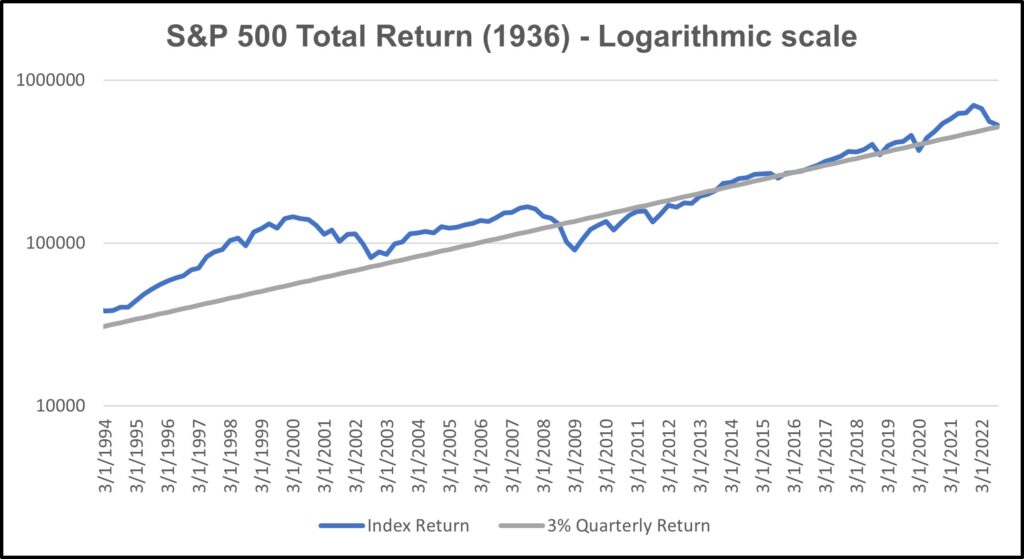
In this context, the overvaluation is still present, but did not approach the extreme levels of the early 2000s dot-com boom. A zoomed-in view better displays how markets in 2022 have reverted to the mean once again as post-Covid euphoria has faded into inflation fighting.
The benefit of using over 85 years of data is the realization that markets can, and often do, stray from the average for a prolonged period. Markets are generally efficient and revert to the average return, but unforeseen events – wars, pandemics, central bank missteps – can trigger prolonged dislocations. It’s always possible that the Fed’s current policy of quantitative tightening and fed fund interest rate increases causes the blue line to break below the grey average return trendline. If that happens, however, the Fed will likely soon be in pivot mode to easing rates and we will once again revert upwards towards and above the mean.
For long-term investors, recognizing the markets are now in line with historical average returns should provide a degree of comfort, despite the emotional challenges of 2022’s downturn. In the long-term, the market rewards patience and fortitude. For tactical investors, caution is still warranted given the complexity of geopolitical turmoil, but this is a potential cue that the bottom is close at hand. The trend is your friend.
Thank you, as always, for the opportunity to serve you.