
The Recession Meme Is Intense: But Can The Market See Around The Corner?
By Dr. George Calhoun
Hanlon Investment Management Advisory Board Member
Executive Director of the Hanlon Financial Systems Center
- “A US recession is certain in the next 12 months in model projections.” – Bloomberg (Oct 17, 2022)
The stock market is capable of remarkable clairvoyance. Sometimes.
At other times, it seems mesmerized by some near-term stimulus so intense that it short-circuits the market’s forecasting “brain.” The focal length shortens, and the meme of the day fills the screen. Lately, it has been the fear of a Rrrr-Recession that may or may not happen.
The most interesting moments, however, are the inflection points – when a market that has been obtuse and myopic suddenly “gains clarity” and can see the deeper patterns that are developing in the economy. These epiphanies are associated with historic market reversals.
Of greatest interest are the reversals that reliably precede economic recoveries, which spark the most violent market rallies. The clairvoyant quality of these events is evident from the fact that they typically anticipate fundamental improvements in the real economy by several quarters. They also precede any shift in explicit market sentiment, which is still dominated by pessimism. The market’s hive-mind seemingly decides to ignore the bleak concurrent economic data (which had previously obsessed it), and begins to price in a recovery that most models cannot yet detect.
Today, in the Fall of 2022, we are in the first phase of such a cycle. The financial world is fixated right now on the prospect of a Recession. Readers of The Wall Street Journal learned this week that –
- “There is ugly stuff coming… The International Monetary Fund says the world economy is headed for ‘stormy waters.’ Ray Dalio thinks we’ll see five years of ‘negative or poor real returns.’ Is that negative enough? It’s a start…”
A Pimco analyst writing in the Financial Times chimes in.
- “The question for macro forecasters has evolved from if we’ll see a recession in large developed economies, to when and how deep?” – (Oct 18, 2022)
Other experts…
- “In the distribution of outcomes, there’s a good chance we could have a recession.” – David Solomon, CEO Goldman Sachs
- “The probabilities in this economy tell you to batten down the hatches.” – Jeff Bezos (on Twitter)
- “Jamie Dimon warned that a ‘very, very serious’ mix of headwinds was likely to tip both the U.S. and global economy into recession by the middle of next year.”
There is no clairvoyance in any of this. It is just standard caution, hedged or unhedged, in the face of multiple uncertainties (war, China/Covid, inflation, the midterms). It is not even real news. The possible/probable recession is broadly acknowledged, and substantially priced in already. The market may slide further, but there are no surprises in this trend. It may go down a little more, or more than a little more. Or just down enough. But all dreary, and predictable.
What is neither dreary, nor easily predictable, but certain – is that after the Recession, or the scare, will come the Capital-R Recovery. It looms just around the next corner.
An important question is: When will the economy turn that corner?
And the most important question — for investors – is: When, and how, will the market discover that it can see around that corner, and start its move well before the economic indicators actually improve?
That is when money will be made in the next cycle. The entry point will not be at the economic bottom, but some time before the bottom. That’s how it always happens.
History is instructive on this point.
The Greatest Trend Reversal In The Stock Market Ever
The most interesting, perplexing, and by far the most important single day in the history of the financial markets occurred 13½ years ago.
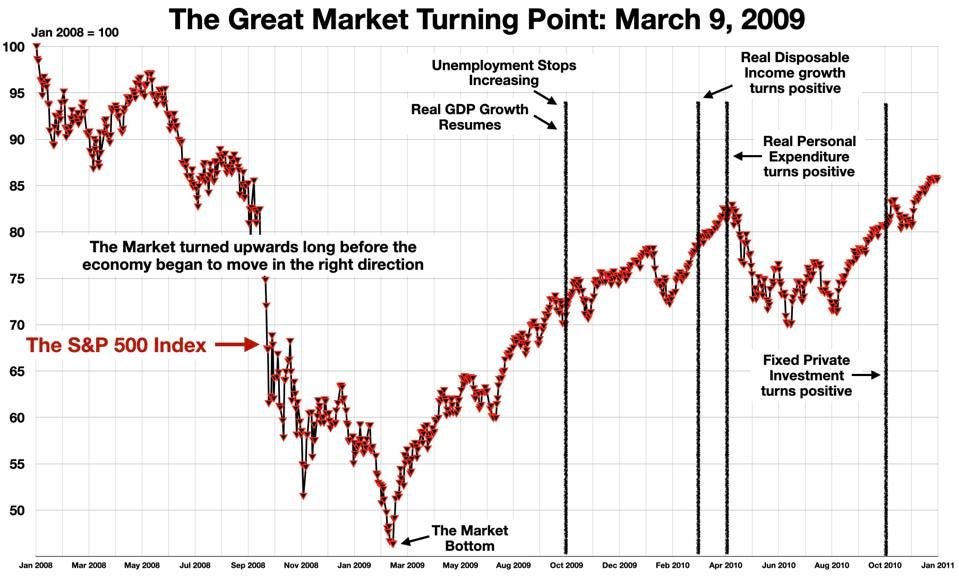
On Monday, March 9, 2009, the U.S. stock market turned a giant corner – sharply reversing direction – and a lot of investors soon made a great deal of money.
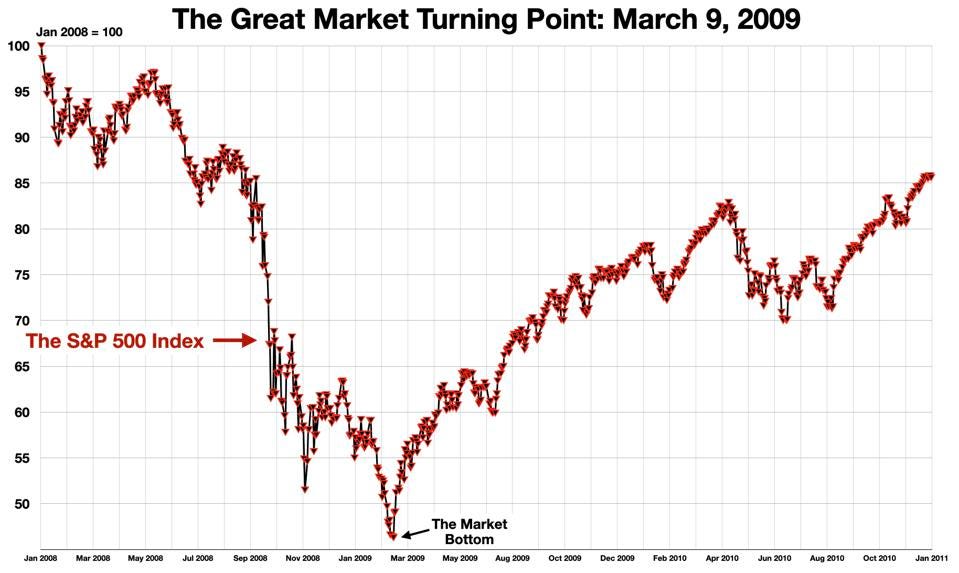
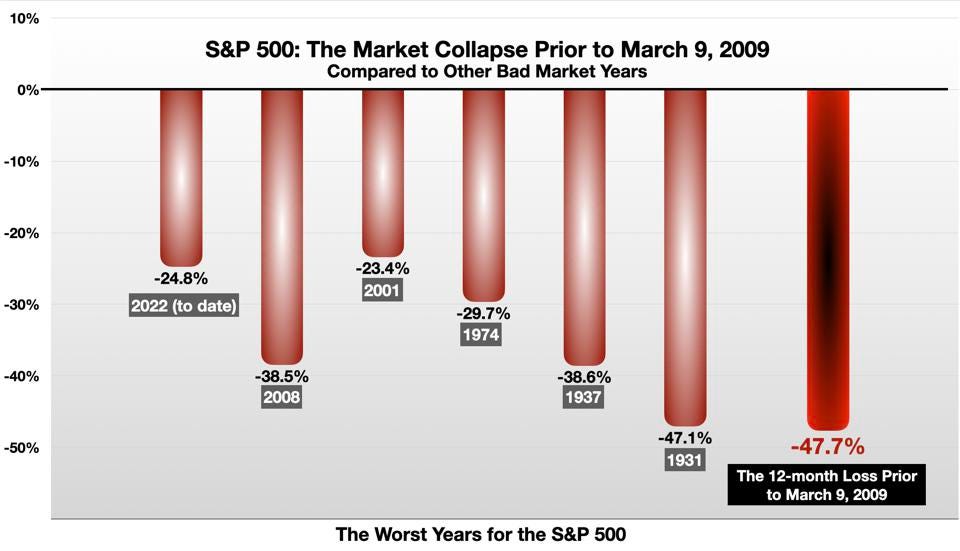
That day is a stand-out in the financial time series. The reversal is very sharp. In the 12 months prior to March 9, the market had experienced a catastrophic decline of 47.7%, worse than any single full-year decline in the history of the S&P 500.
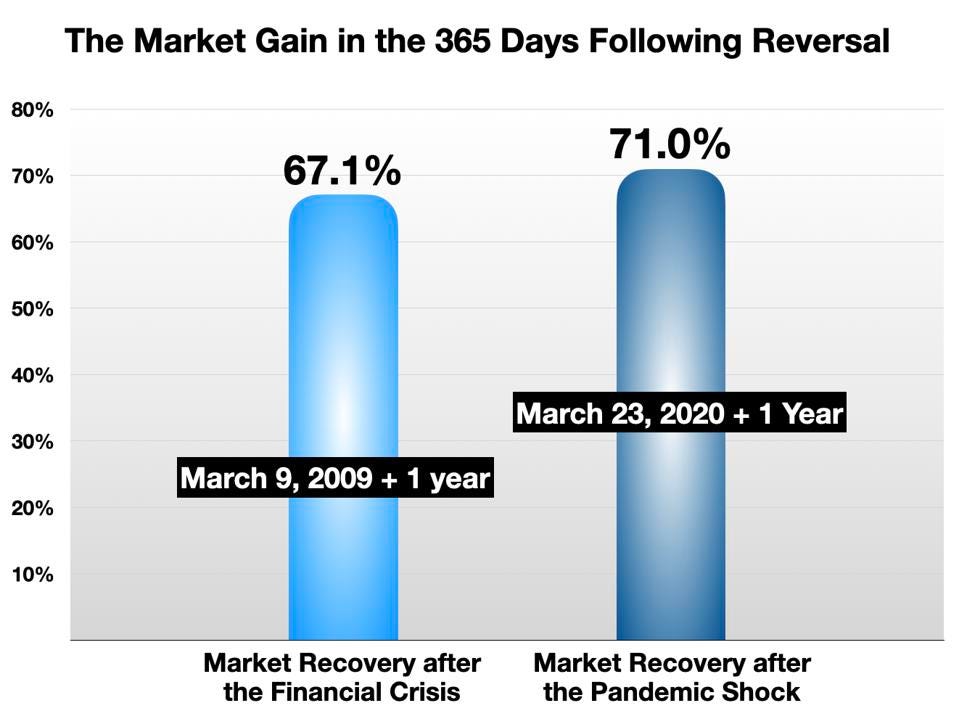
Then, in the 12 months following that day, the market gained 67.1%, far more than any annual gain.

March 9, 2009 turns out to have been Day 1 of the 13-year-long bull market which took the Dow from 6500 to 36000.
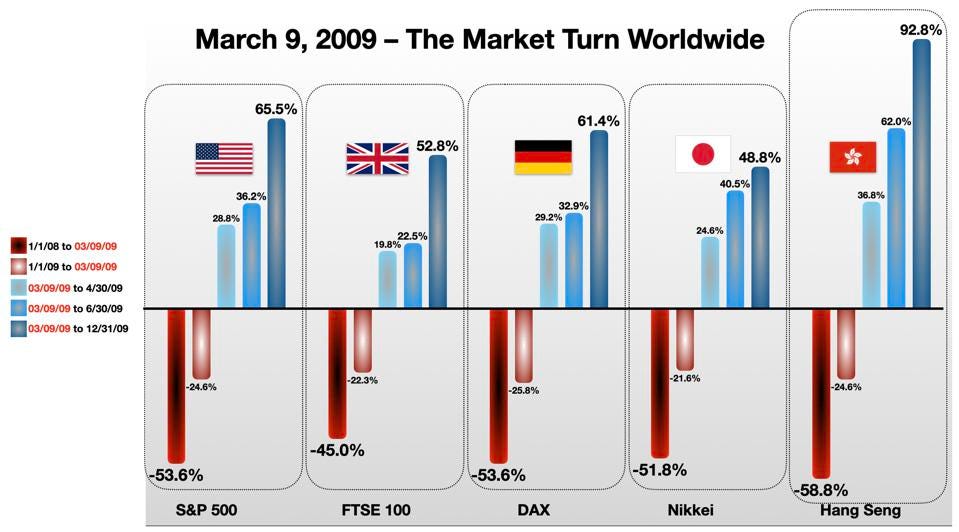
The reversal occurred simultaneously in all major equity markets around the world. The change in the market weather was global, sudden and overwhelming. Markets everywhere, which had fallen disastrously until that point, were up 20-40% in the next 6 weeks, and 50-90% by year-end.
What happened to ignite this explosion?
Nothing happened. There was no economic or political news of any significance that day. Wikipedia’s Current Events portal tells us there was a mutiny in Madagascar. Argentina rejected British claims on Antarctic territory. President Obama lifted some restrictions on stem cell research. Nothing of any substance.
What was most striking about this market surge is that it occurred well before the real economy showed any significant signs of improvement. In March 2009, everything was bleak. Consumer sentiment was very near its all-time low. Analysts’ profit forecasts for the private sector were their lowest ever., The country, and the world as a whole, were stuck in the deepest recession since the Great Depression, and nowhere near the bottom.
- U.S. Unemployment was at 8.3% – and would continue to rise for the next 7 months to a peak of 10%. That meant 10-12 million people out of work in a year. (The labor market did not recover fully for many years.)
- On a per capita basis, Real GDP would not begin to grow again on a year-over-year basis until October 2009.
- Real Disposable Income growth turned positive only a year later in March 2010.
- Real Personal Expenditures growth did not turn positive year-over-year until April 2010.
- Fixed Private Investment hit bottom in Q1 2010 and did not grow again until Q4 2010.
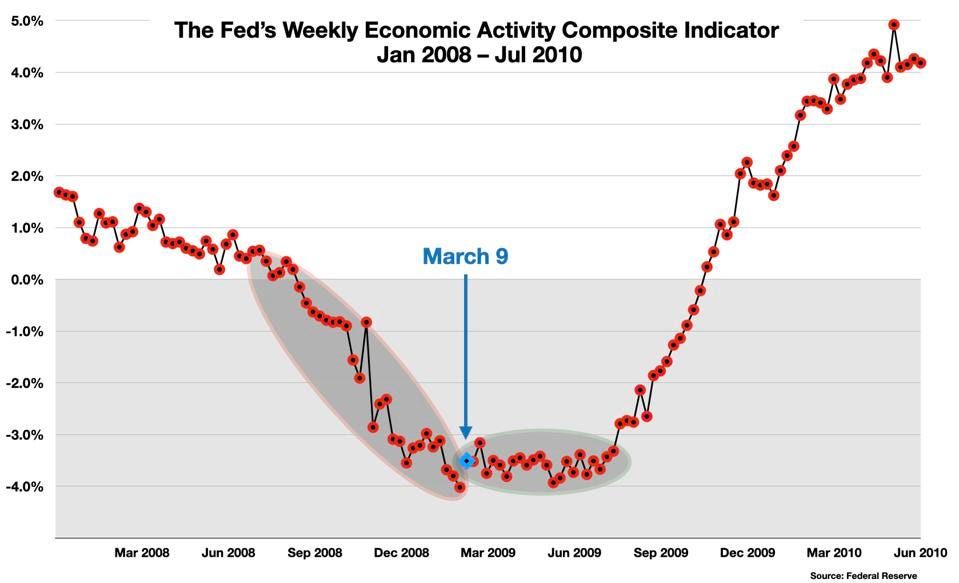
- The Federal Reserve’s Index of Economic Activity (see below) was in free fall and did not register expansion again until mid-November, 8 months later.
The financial market moved against these immediate economic trends, turning sharply upwards several quarters ahead of any actual economic improvement.
How could this happen? It happened because…
The Market Sees Around The Corner
That is what markets do. The stock market is famously, and in general, forward looking. Today’s stock prices anticipate – they “price in,” as finance-speak calls it – events and developments expected to occur several quarters out into the future.
The simplest rationale is simply stated: Investors buy the future. The only reason to study the past is that it may give some indication of what will happen in the future. Markets process information in the present, and information from the recent past, to develop a forecast of what will happen in 30, 90, or 180 days. This is why the market is said to “see around the corner” – and move to take advantage of changes in the economy before they begin to show up in the official economic data.
The phenomenon has been studied by academics for many years. A 1996 paper by Comincioli found that the stock market’s forecasting performance is quite strong out to 3 quarters ahead. In the peculiar vocabulary of statisticians –
- “These results indicate that stock prices do ‘Granger cause’ economic activity when lagged orders of 1, 2, and 3 [Quarters] are used [ie., it predicts out to 3 quarters in the future]. That is, past values of the SP500 significantly contribute to the prediction of current GDP… That is, the stock market does predict the economy.”
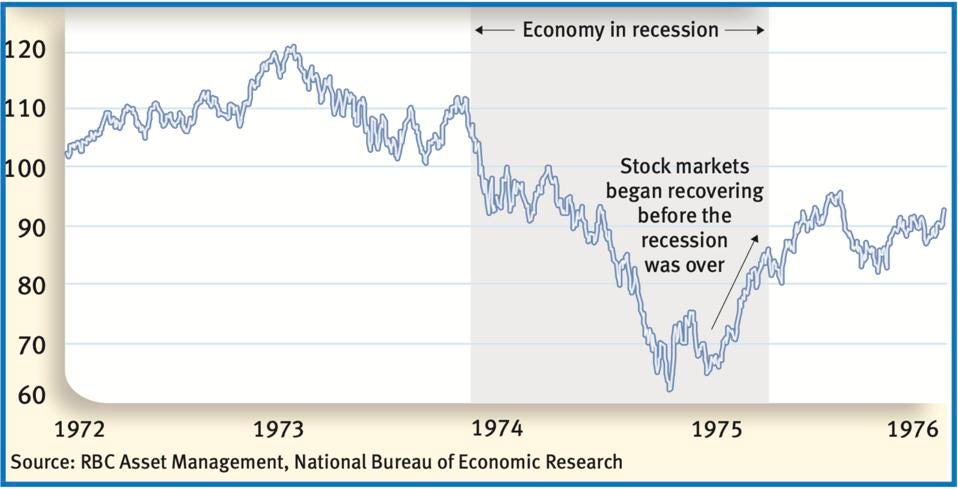
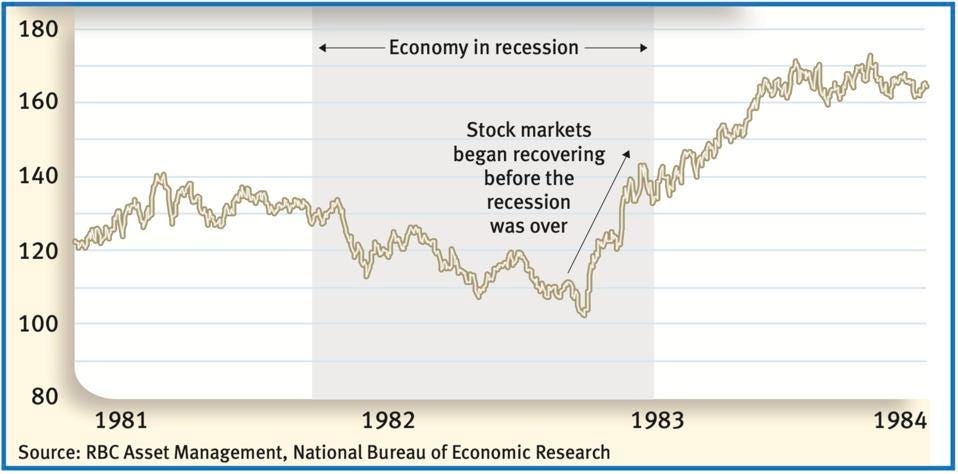
This occurs frequently and reliably. For example, the stock market began to recover in 1975, and in 1982, before the recessions in those years had ended, as shown here in charts by RBC.
But this demonstration of clairvoyance does not answer the question: How does the market do it? What does it see?
What Did The Market See in March 2009
The logic underlying the great turn on March 9, 2009 was triggered by a perception that the processes of decline and deterioration in the economy were not stopping, yet. But the rate of decline… had stopped declining. A glimpse of this can be found in the Federal Reserve’s Weekly Economic Index is a composite of 10 weekly economic indicators, “the common component of ten different daily and weekly series covering consumer behavior, the labor market, and production.”
- “The WEI is an index of real economic activity using: same-store sales, the Rasmussen Consumer Index, new claims for unemployment insurance, continued claims for unemployment insurance, adjusted income/employment tax withholdings, railroad traffic originated, the American Staffing Association Staffing Index, steel production, wholesale sales of gasoline, diesel, and jet fuel, and weekly average US electricity load. These series are combined into a single index of weekly economic activity.”
The rate of the economic decline accelerated from September 2008 until March 9 2009 – when it abruptly stabilized. The “slowdown” slowed down. Although economic expansion did not resume until the end of 2009, the economy was no longer in free fall.
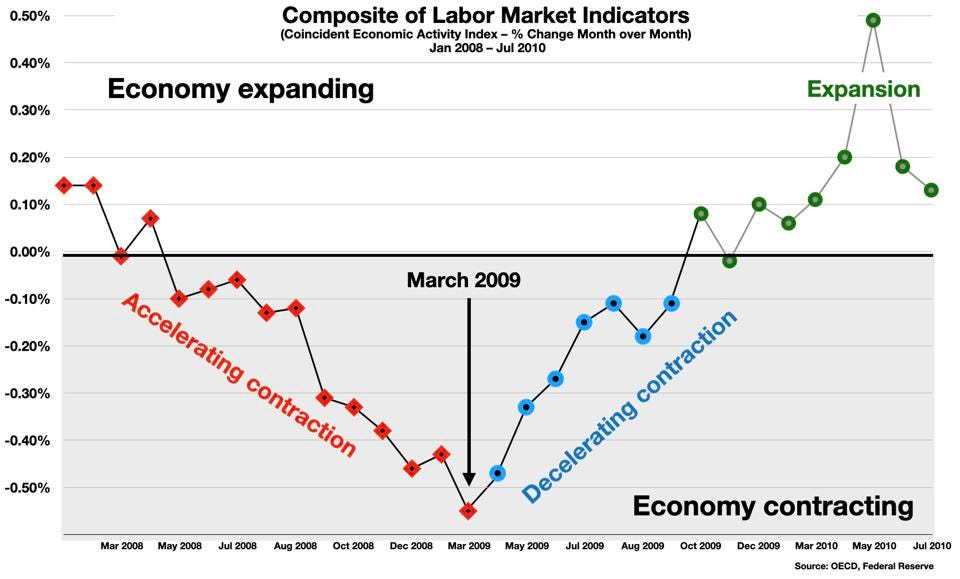
Another composite index of labor market indicators (the so-called Coincident Economic Activity Index, which combines nonfarm payroll employment, the unemployment rate, average hours worked in manufacturing and wages and salaries) tells the same story. Labor market activity contracted from May 2008 through November 2009. The contraction worsened and accelerated until March 2009, when the rate of deterioration finally began to moderate.
One more indicator shows the same turning point. The international Organization for Economic Cooperation and Development (OECD) compiles a monthly Composite of Leading Indicators (CLI). In March 2009, this index hit its low point – and began to climb out of the trough.
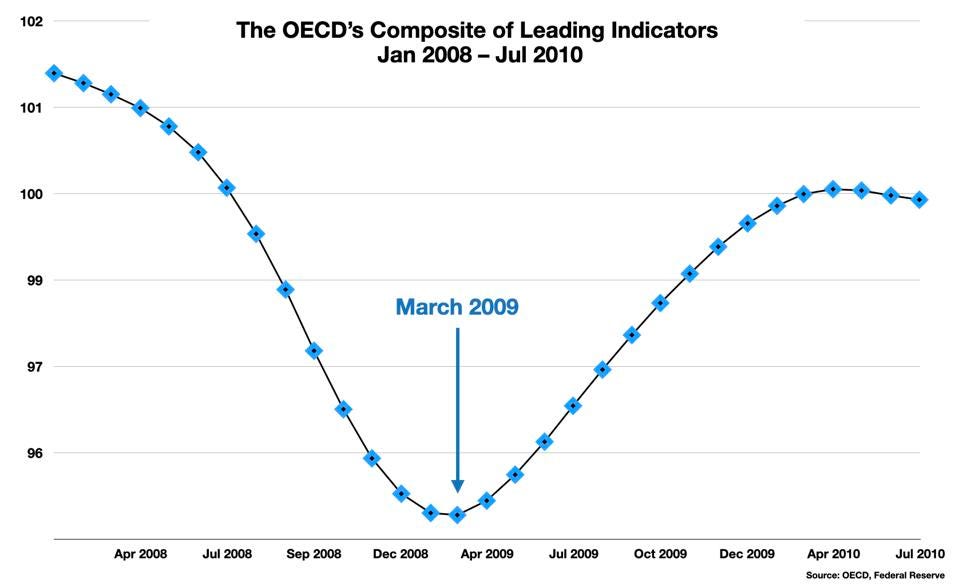
Note that in March the CLI had not yet started to signal a positive future; these encouraging U-shaped curves did not yet exist. But with spooky clairvoyance, somehow, the stock market picked up this rather obscure shift buried deep in the data – and took off like a rocket.
Note also that these indicators are complex composites. The signal is weak, and as of March 2009 the simple indicators are too noisy to show it yet. By combining a number of perspectives, the noise can be averaged out and the signal becomes clearer. The fact that the market, vast and undirected as it is, can apparently perform this complicated signal processing task is astonishing.
The trigger here was not “good news.” It was not even the absence of bad news. It was the news that after many months of steepening decline, the bad news was beginning to become a little less bad. Somehow, in its mysterious ways, the market sensed this stabilization in the otherwise dismal economic process. It foresaw the first glimmer of the recovery.
The Pandemic Case: Another Rocket-Market
The Covid outbreak which hit the U.S. in February/March of 2020 was the blackest of black swan events in recent economic history. It might have been expected to throw the pattern off kilter. The pandemic introduced so many unknowns and imponderables. Recall that very little was known at the time about the virus, its infection rates, its virulence for different segments of the population, the mortality rates, the mutation potential. There was no established protocol for treatment, and no vaccine. The official view in the Spring of 2020, based on all prior experience with vaccine and drug development, was that it might take years to develop effective medical countermeasures, and they might show only limited effectiveness. Patterns of economic behavior were going haywire, thrown off by urgent lockdowns and quarantines. Streets emptied of traffic. Oil prices plunged as demand evaporated. Travel shut down, businesses closed, and unemployment soared from 3.5% to almost 15% in a few weeks.
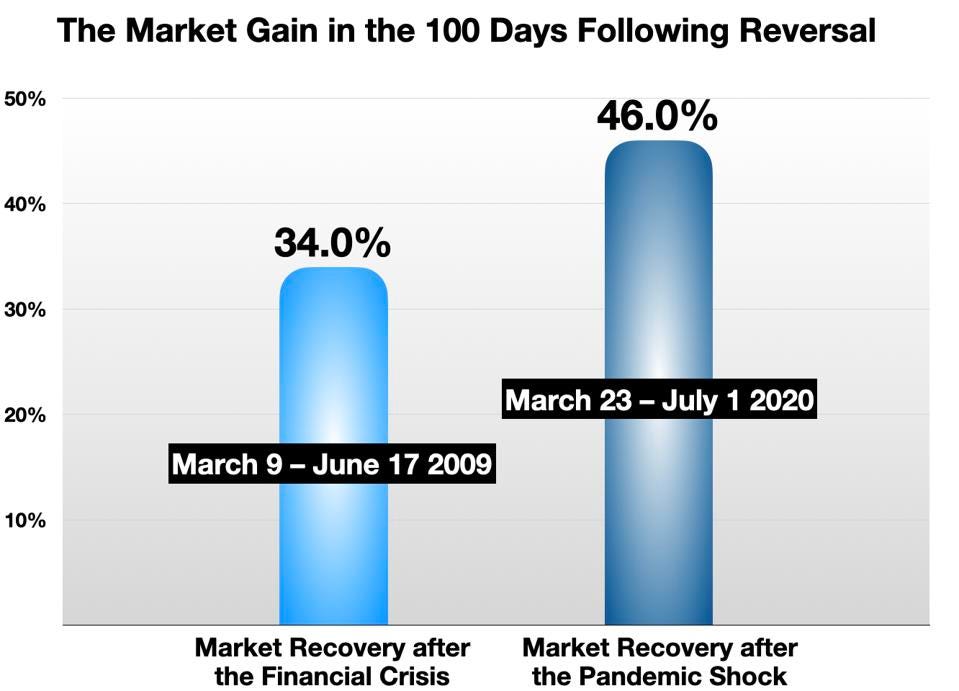
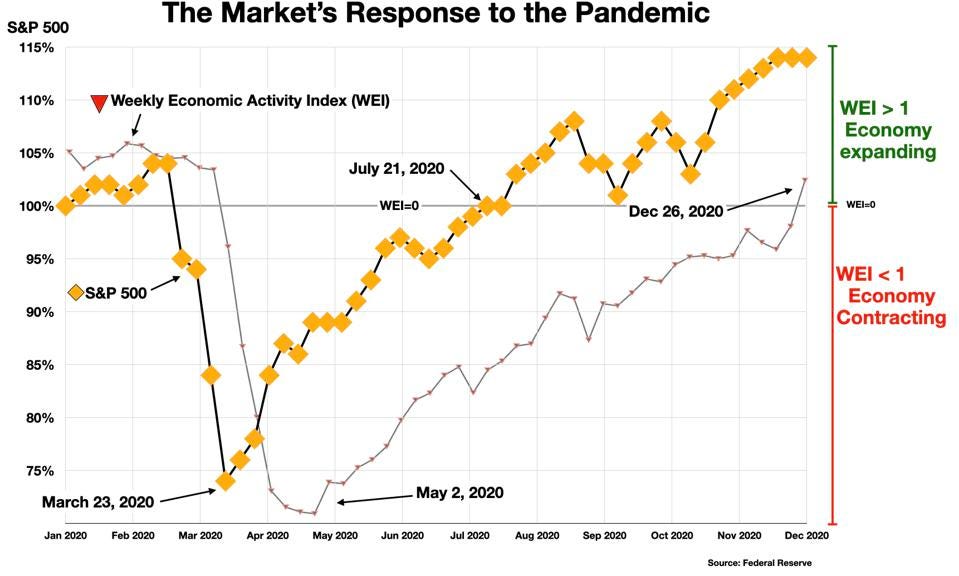
And yet, the market quickly diagnosed the situation, and on March 23, 2020 – less than 4 weeks after the first shock – in an eerie repeat of the 2009 reversal, the market touched its bottom and turned. In fact, the market recovery was even faster and stronger than after the Financial Crisis in 2009. In the 100 days following March 23 the market gained 46% — recovering completely to the pre-pandemic level (vs 34% gain in the 100 days following March 9, 2009).
The recovery was even stronger over the following year.
The rally following the pandemic shock was similarly prescient, running against the surface data. The Federal Reserve’s Economic Activity Index was still plunging, and did not touch its bottom until two months later. The economy did not resume its expansion until the end of the year – by which time, the stock market was 15% higher than it had been when the pandemic hit.
The Relevance Now (2022) – The Market’s Temporary Blindness
How does this bear on the present moment?
We are almost certainly approaching another corner-turn in the economy. We may have already started to turn that corner, in fact. Yet the stock market seems to have lost its clairvoyance. Its forecasting focal length has again contracted. One could say that as an information processing system it is not doing its job right now.
The “Corner” in question is not the ballyhooed Recession. There is no more money to be made on that bet. From the perspective of the financial markets, recessions are dull affairs in any case, predictable and infertile. A waiting game.
The coming Corner is the next market reversal, which will precede and signal the economic reversal. The upside explosion that will take place when the market detects the first signs that the recession is starting to end (or may not even happen) – which it will see well before the economic indicators turn up, well before the recovery actually takes place. These are the most explosive opportunities that investors can ever hope to find.
At some point – and I think soon – the market’s clairvoyance will snap back, and it will be electrifying. That will be the moment to be in the market to the hilt. But –
There is an important obstacle — a factor that is blocking our vision, and impairing the clarity of the market’s information processing powers. In Part 2, we will consider that source of our collective short-sightedness: the Federal Reserve, which has fallen behind the curve of events, and has become a follower rather than a leader in the broader economic process.
Click here to download a copy of advisory.
About the Author:
DR. GEORGE CALHOUN, A GRADUATE OF THE UNIVERSITY OF PENNSYLVANIA, RECEIVED HIS DOCTORATE DEGREE FROM THE WHARTON SCHOOL OF BUSINESS. He has served in multiple capacities in the Financial Sector and in the Wireless Communication Industry. He has authored multiple articles on subjects of interest to him and several books. His most recent book “Price & Value: A Guide to Equity Market Valuation Metrics” is available through the Publisher Springer/Aspress. Dr. Calhoun currently serves as the Executive Director of the Hanlon Financial Systems Research Center at the Stevens Institute of Technology and is an Advisory Board Member of Hanlon Investment Management.