
Positive Market Breadth is a Bullish Setup

May 14, 2024
It’s no secret that the US stock market has become increasingly concentrated in recent years, with the largest, most dominant technology companies representing a disproportionate amount of the S&P 500 Index’s market capitalization. The top 10 largest S&P 500 companies account for 1/3 of the index’s total market capitalization and therefore the overall direction of the market can easily be swayed by a minority of stocks. With the growth of the “Magnificent Seven” mega-cap names to multi-trillion-dollar valuations, even a single name can drive the S&P 500 on any given day.
Consider April 25, a day when the S&P 500 was up 0.95%, a solid single day return. One would think that a considerable majority of the index would be green on such a day, yet the underlying data shows that 240 stocks, nearly half the index, were flat or negative. The overall index performance was skewed by a 6.2% daily return from Nvidia (NVDA) and a 10% return on Alphabet (GOOG). This example demonstrates how a single-day pop due to earnings or positive news on even one mega-cap name can create a misleading narrative of overall market direction if we only pay attention to the headline index performance. For this reason, it is important that we keep an eye on what is taking place under the surface.
One of the ways we assess the overall “health” of the market is by looking at measures of market breadth (see prior commentaries here, and here). When the market is in an uptrend, we want to see most of the stocks within the index advancing to give us confidence that the rally is sustainable. We can measure market participation, or breadth, by looking at indicators such as the Advance-Decline (A/D) Line, which simply plots the number of advancing vs. declining stocks, or the McClellan Oscillator, which smooths out A/D fluctuations and puts more emphasis on recent data via the application of an exponential moving average.
The below chart shows how the McClellan Oscillator (the green and red bars below the chart) can give additional insight to the daily price action of the index (shown in the main, larger chart). At the onset of November 2023, the market bottomed out and reversed higher after a dovish Fed meeting. The market rally was broad, as reflected by the strong, persistent green McClellan Oscillator readings. The rally continued to start 2024, but as the McClellan chart reveals, breadth was relatively poor because big tech was moving higher while the rest of the market stalled out. In the second half of February through the beginning of April, the market kept appreciating but breadth was choppy. Breadth quickly deteriorated in April as inflation data led investors to de-risk and initiate broad selling. This brings us to our present situation roughly 1/3 of the way through May, as breadth looks healthier thanks to strong Q1 earnings and positive 2024 guidance.
Exhibit 1. S&P 500 and McClellan Oscillator
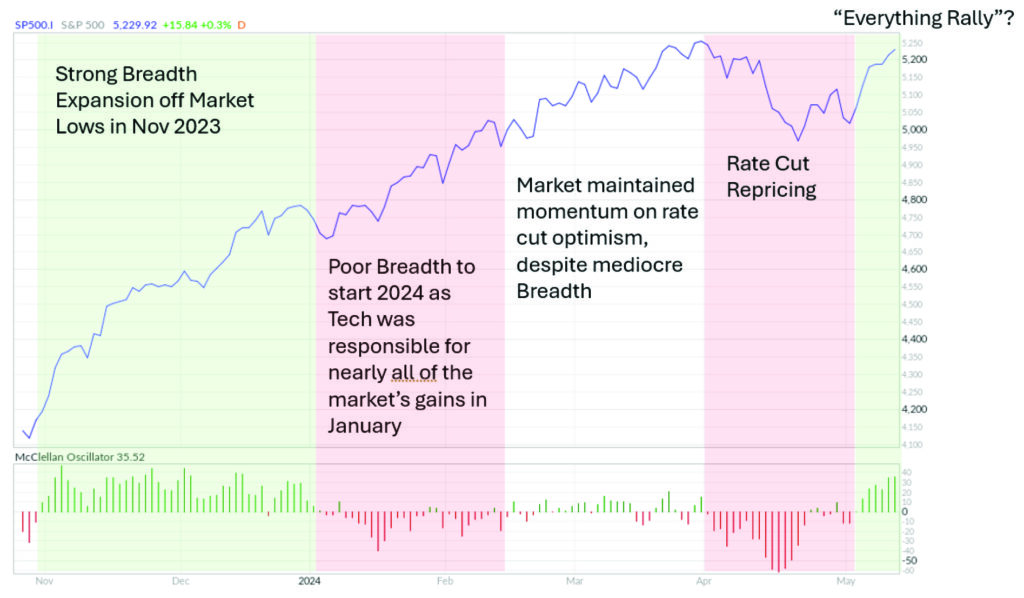
As the consecutive green bars on the McClellan Oscillator show, the recent breadth expansion is the strongest thus far in 2024 and indicative of a market that could gain breakout momentum as we retest the prior highs. While it is a small sample size, looking at the five-day run from May 3 through May 9th shows all sectors moving higher in unison.
Exhibit 2. S&P 500 SPDR Sector ETF Performance 5/3/2024-5/9/2024
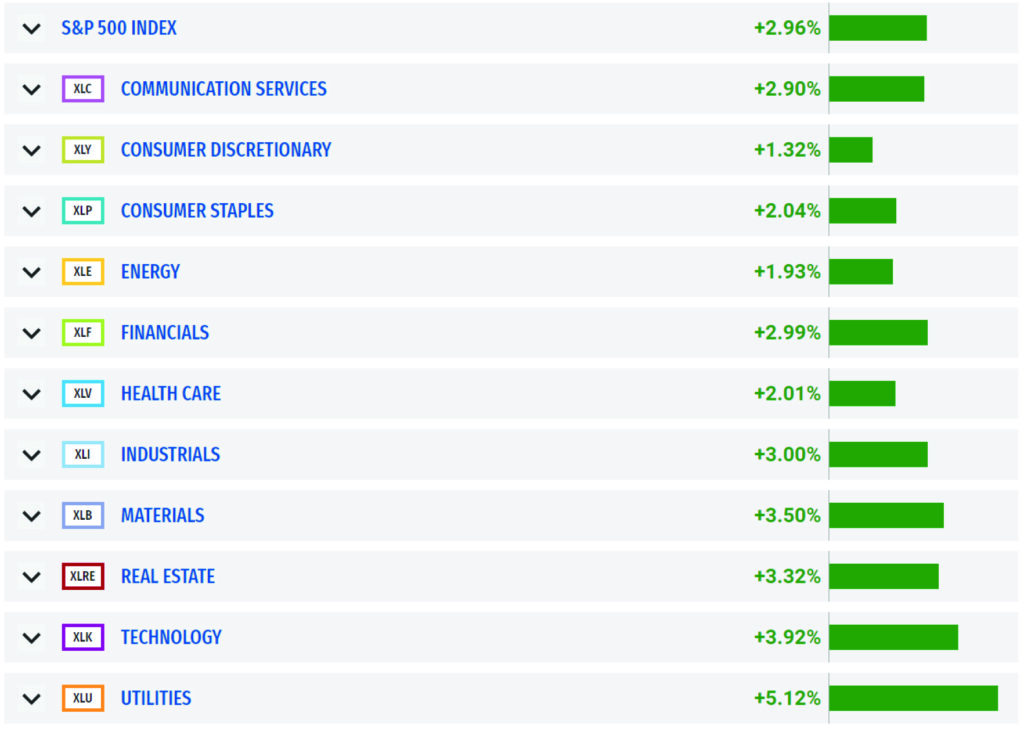
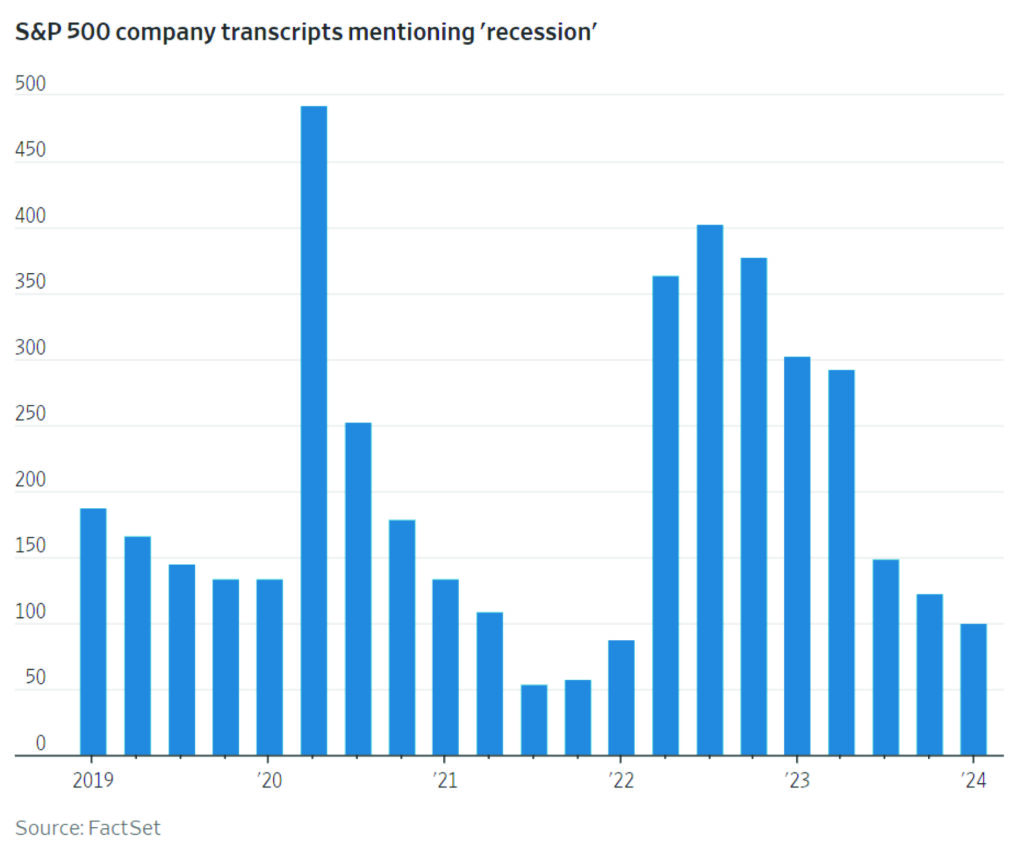
Year-to-date, all sectors aside from Real Estate are positive, which is encouraging considering that investors were expecting as many as six rate cuts coming into 2024 and now have repriced those expectations to a baseline of just one or two cuts at most. Stronger-than-expected corporate earnings have offset the negative impact of disappointing inflation readings and the good news is that those strong earnings have come from more than just the technology sector. In addition, CEOs are striking an upbeat tone, with fewer and fewer mentioning recession. The dreaded R-word came up just 100 times in Q1 earnings calls, compared to triple that amount a year ago.
Exhibit 3. “Recession” Mentions during Q1 Earnings Calls
We may need a better-than-expected inflation reading to spark a major rally, but the setup appears to be in place. The great corporate earnings, positive guidance, and willingness to engage in capex are all reflected in the strong GDP growth we have seen in recent quarters and expect to see yet again in Q2. The fact that participation is broad among US equity sectors gives us some confidence here that if we do see a rally commence from present levels, it could be one with staying power.
Thank you, as always, for the opportunity to serve you.
Read the Forbes article – Here
Vestbridge Advisors, Inc. (“VB”) Is registered with the US Securities and Exchange Commission as a registered investment advisor with principal offices at 3393 Bargaintown Road, Egg Harbor Township, NJ. The information contained in this publication is meant for informational purposes only and does not constitute a direct offer to any individual or entity for the sale of securities or advisory services. Advisory advice is provided to individuals and entities in those states in which VB is authorized to do business. For more detailed information on VB, please visit our website at www.Vestbridge.com and view our Privacy Policy and our ADV2 Disclosure Document that contains relevant information about VB. Although VB is a fairly new organization, any references herein to the experience of the firm and its staff relates to prior experience with affiliated and nonaffiliated entities in similar investment related activities. All statistical information contained herein was believed to be the most current available at the time of the publishing of this publication.