
Inflation Is Over – What Comes Next?
October 7, 2023
By Dr. George Calhoun
Vestbridge Advisors, Inc. Advisory Board Member
Executive Director of the Hanlon Financial Systems Center
Here is how some of the leaders of the financial establishment see the inflation situation today.
- “While inflation has fallen a lot, it continues to be almost 2 percentage points higher than our target.” – President of the San Francisco Federal Reserve
- “Although there has been some progress, inflation remains too high.” – President of the Cleveland Fed
- “I know of no theoretical framework that can tell us how much we will need to tighten long real rates to get inflation back to target in a reasonable time frame.” – President of the Minnesota Fed
Wrong. Wrong. And …Uncertain, but leaning to Wrong.
The recent inflation data paint a very different picture.
Unpacking the Latest Inflation Figures
The August figure showing a 0.1% rise month-over-month in the Personal Consumption Expenditure Index (PCE), published last week (Sept 29), is very revealing – or should be.
This is what the headlines should have said.
- “Inflation” is over. We have met the Fed’s 2% target.
- In fact, the data are starting to signal looming deflation.
- As the rate of inflation fell in the last year, consumer spending (“demand”) accelerated.
- As the rate of inflation fell in the last year, unemployment held steady at historic lows.
In other words, at least two of the standard causal theories for inflation failed to explain this episode. “Excess demand” is not driving price increases. “Wage pressure” is not driving price increases. Leading economists’ models have generated predictions that have turned out to be ludicrously – and thankfully – incorrect.
That’s a lot of “debunking” packaged into one metric. Let’s elaborate.
1. Inflation is over.
- “Three good months in a row” – Front-page headline in The Financial Times (Oct 1, 2023)
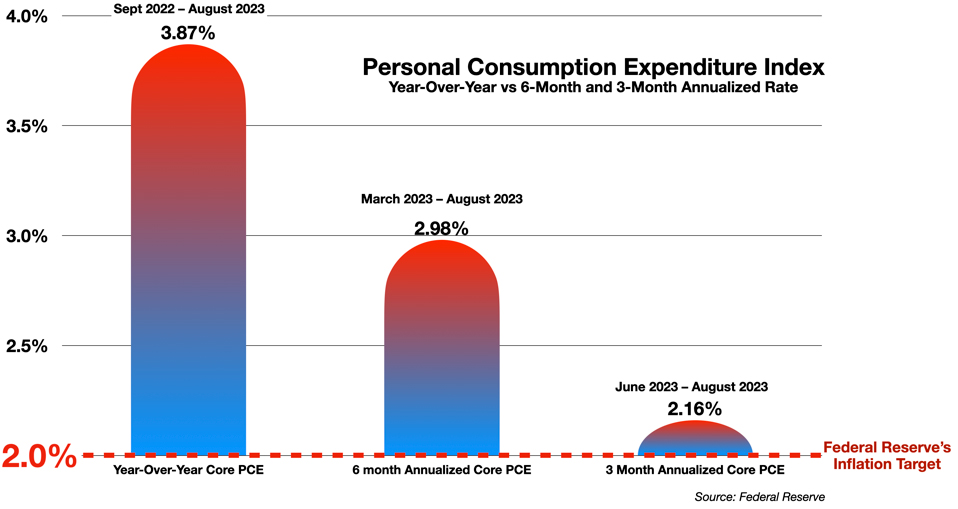
The Core PCE (which excludes volatile energy and food price) rose just 0.1% in August compared to July. Over the last three months, it has risen at an annualized rate of just 2.16%.
In fact, the trailing 3-month run rate (annualized) has been declining steadily all year.
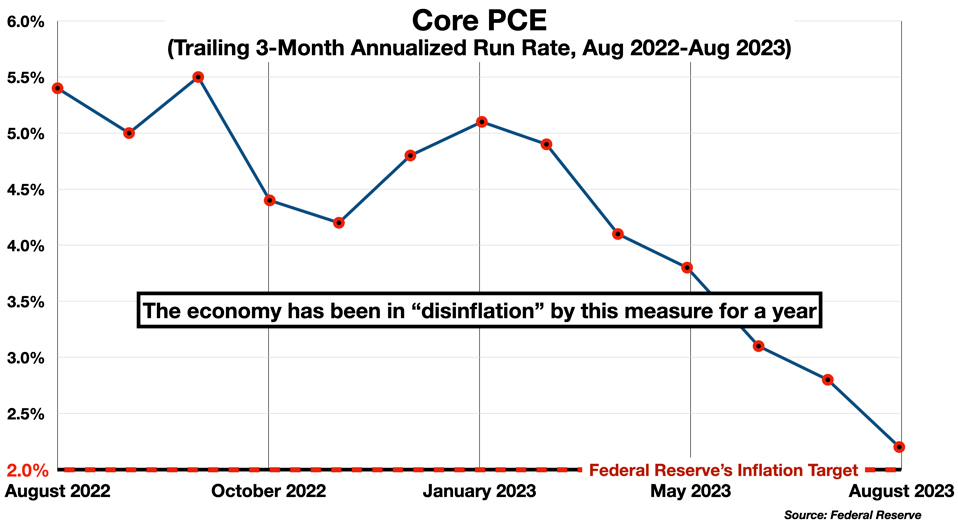
This is a strong indication that “inflation” is over – if “over” means that the current rate has fallen back (nearly) to the Fed’s 2% target.
Two questions may arise:
- Is it legitimate to use a shorter term run rate (e.g., 3 months) rather than the traditional 12-month year-over-year comparison?
- Is it legitimate to rely on the Core PCE – which excludes Food and Energy – instead of the headline PCE (which includes all components)?
Justification for the Shorter Run Rate
The Federal Reserve has been criticized for being late to recognize the emergence of inflationary trends in 2021 and 2022. This is largely a consequence of the Fed’s reliance on year-over-year measures of inflation, which create a built-in delay in the inflation signal – as described in my previous column, here. By emphasizing year-over-year comparisons, the Fed can’t see changes in price trends until long after they have occurred.
Averaging over a period longer than a single month is reasonable, to compensate for the high volatility in the month-to-month readings. But only up to a point. The longer the averaging interval, the more information is lost or becomes stale. Averaging the signal out over a full year, looking backwards, means the Fed will be too slow to capture the changes in the economy, as some prominent economists are beginning to recognize.
- “Most working economists consider a year to be too long a lag. The inflation situation is changing rapidly.” – Paul Krugman, in The New York Times (Sept 15, 2023)
The year-over-year measure is out-of-date by definition. Averaging over the past 3-6 months provides a much more accurate picture of the current state of the economy, while still moderating the monthly volatility.
This is not a radical idea. Financial journalists have begun to cite the 3-month run-rate more often – e.g. here, and here, and here. Even some Fed leaders have started quoting the 3-month and 6-month rates in favorable contrast to the traditional year-over-year comparisons. Lael Brainard, former vice-chair of the Fed, gave a speech in January that implicitly recommended short-term averages over the traditional year-over-year figures.
- “Inflation in December is likely to have run at around a 2.3 percent annualized pace on a 3- and 6-month basis, as compared with 5.1 percent on a 12-month basis.”
A consensus on this point is developing. I predict that in the future the shorter averaging intervals will displace the year-over-year measure.
Why the Core PCE is Preferable
Food and Energy prices are consistent sources of monthly volatility. “Core” measures remove these from the index, for a more accurate picture of broad inflation trends.
The volatility-reduction is significant. From 2000 until 2019, the headline PCE was 2.5 times more volatile than the Core PCE.
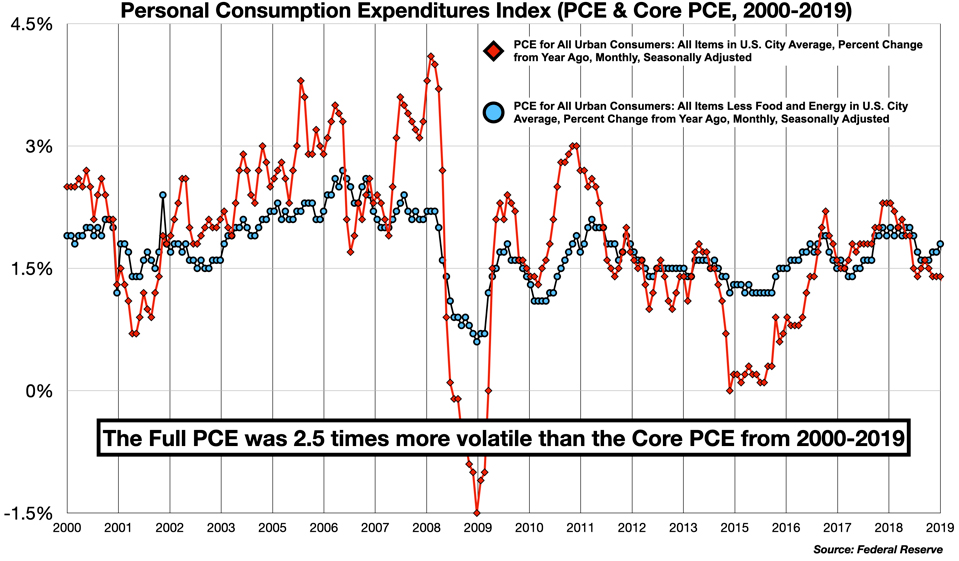
Gasoline prices in particular contributed the most to the increase in the headline PCE in August. Over the last 10 years, the year-over-year price of gasoline (measured weekly) was almost 17 times more volatile than the Core PCE.
A more sophisticated volatility-reduction strategy is found in the index developed by the Dallas Federal Reserve: the Trimmed Mean PCE, which dynamically eliminates the biggest gainers and the biggest decliners from the index each month. This metric shows even more clearly the disinflation – and even deflation – now developing in the economy.
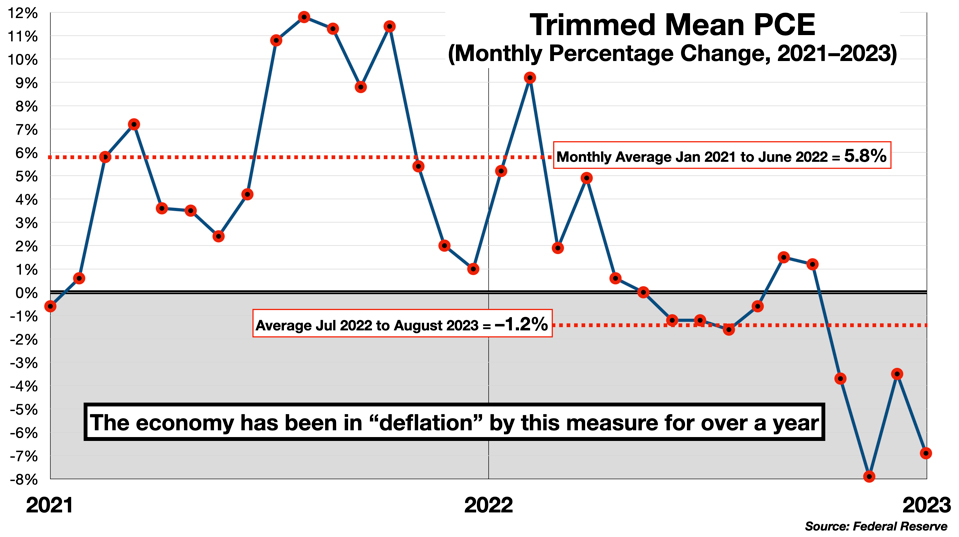
In sum, we get a better picture of what is really happening right now by (1) using a shorter averaging period, and (2) trimming the most volatile components in the index.
- “Jason Furman, a Harvard university professor and former administration official, said the US data marked ‘three unambiguously good months in a row’ for core inflation, which excludes energy and food and is watched closely by central banks as a gauge of underlying price pressures.” – The Financial Times (October 1, 2023)
2. Consumer Spending Has Accelerated In The Last Year – Inflation Came Down Anyway
- “Inflation…induced by lower supplies of raw materials may call for a policy response different from the traditional tonic of demand restriction called for by a ‘garden-variety’ inflation generated by excess demand.” – Economist Robert J. Gordon (1975)
One of the standard theories of inflation holds that it is caused by “excess demand.” Too many buyers, with too much money, crowding the market and bidding up prices.
Was this the cause of the inflationary spasm of 2021-2022? The large post-pandemic stimulus programs made this Demand-Driven model of inflation seem plausible to many. $5 trillion flooded the economy, including $800 billion in cold cash distributed to ordinary people – stimulus checks direct to individuals and families. It seemed obvious to many that all that money would find its way into the economy in the form of higher spending – indeed that was the explicit purpose of the stimulus – and it also seemed obvious, to critics, that it would stoke inflation.
Tracking the effects of the stimulus money through the economy is challenging. All the charts show the effects of the multiple shocks that set the system ringing like a bell in 2020 and 2021.
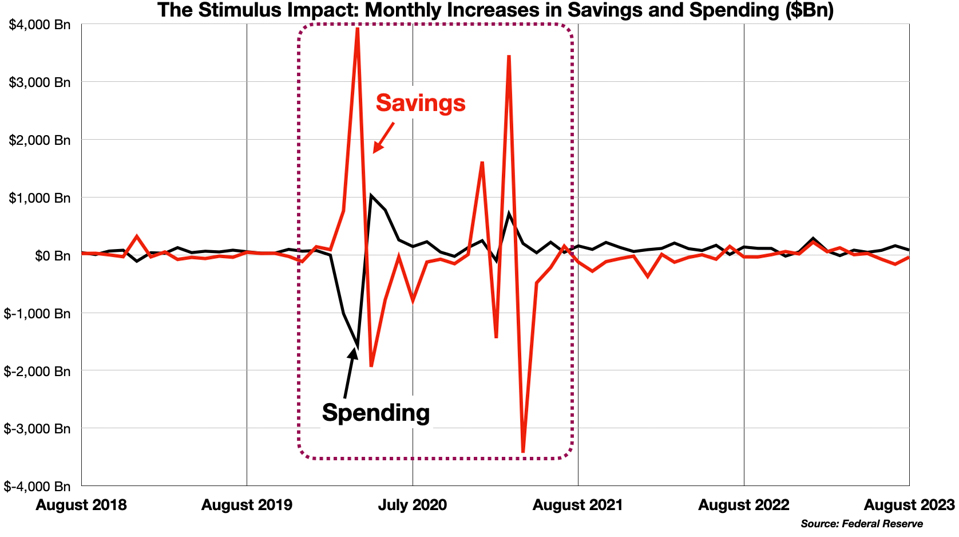
Initially, the surge in consumer income went almost entirely into savings, not spending. Savings quadrupled to nearly $4 Trillion, and then slowly bled out into increased spending. The chaos took about 18 months to work through the system, with both savings and spending gyrating wildly. It is difficult to model these effects.
Once the normal pattern was re-established, however, spending continued to rise even as inflation began to fall. In the last six months, consumer spending has accelerated – rising at an annual rate of about 5% – while inflation (PCE Core monthly annualized run rate) has fallen from 4.1% to 1.8%.
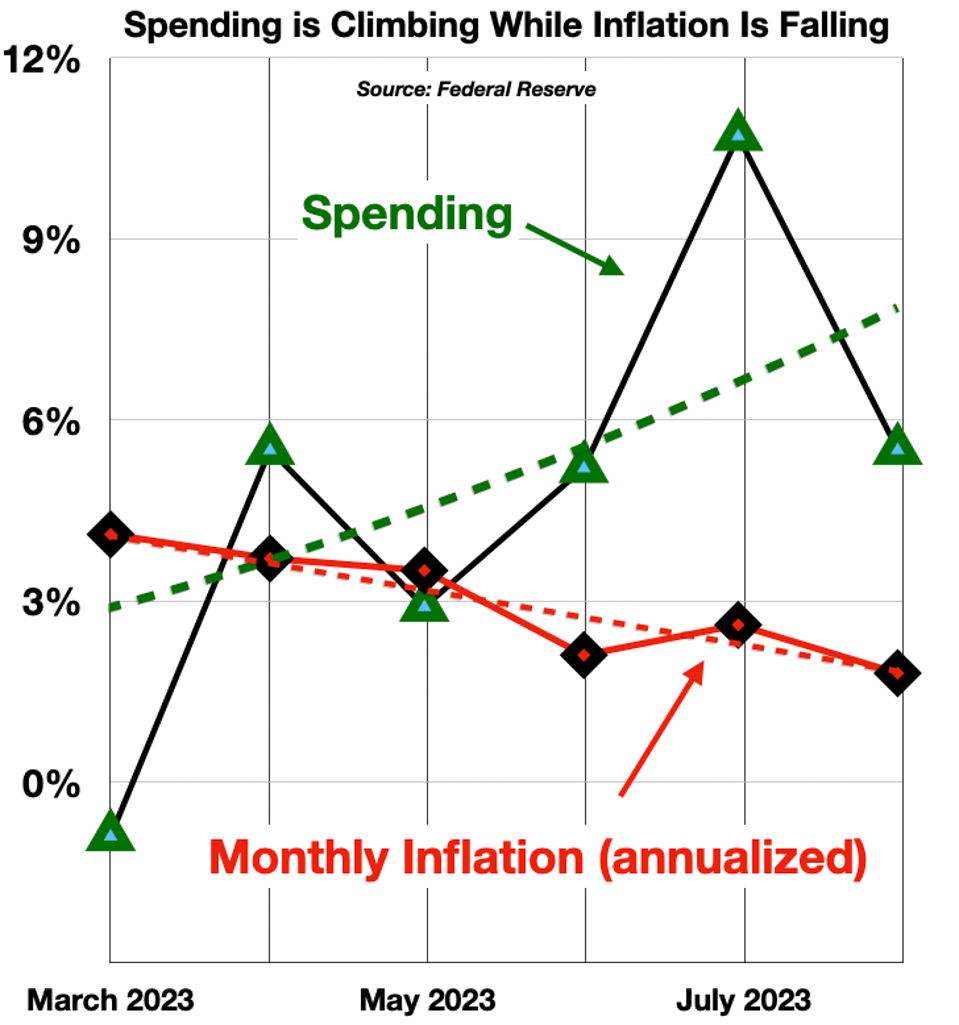
In short, inflation is now falling even as consumer spending is rising. While the stimulus did to some degree “stimulate” consumer expenditures, the recent rise in prices cannot be fully explained by “excess demand.” Recent inflation was principally caused by constraints on the supply side (as several of my recent columns have illustrated in detail).
3. “Wage Pressure” Is Not Driving Inflation
The Fed has obsessed over the strength of the labor markets, right up to this week’s stronger-than-expected jobs growth data. But it is not clear that this has anything to do with inflation. Wage growth, like spending, has been trending upwards, while inflation has declined sharply over the last 6 months.
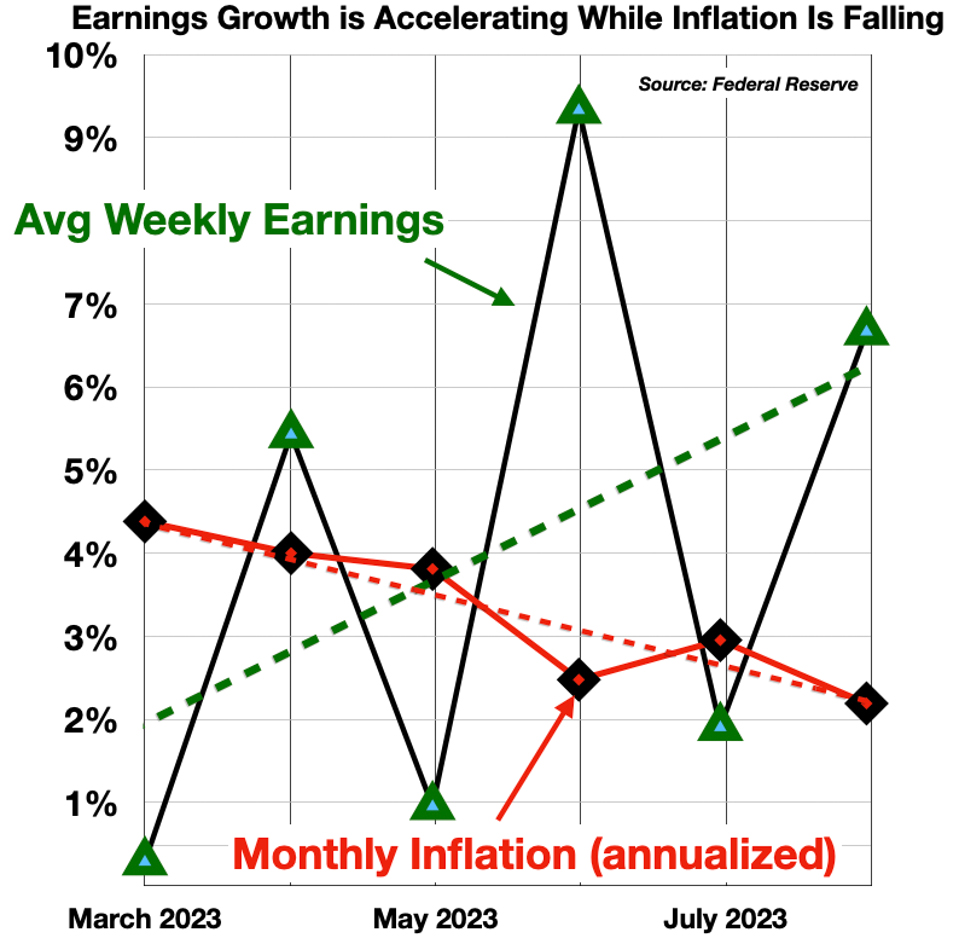
More important — unemployment is not increasing.
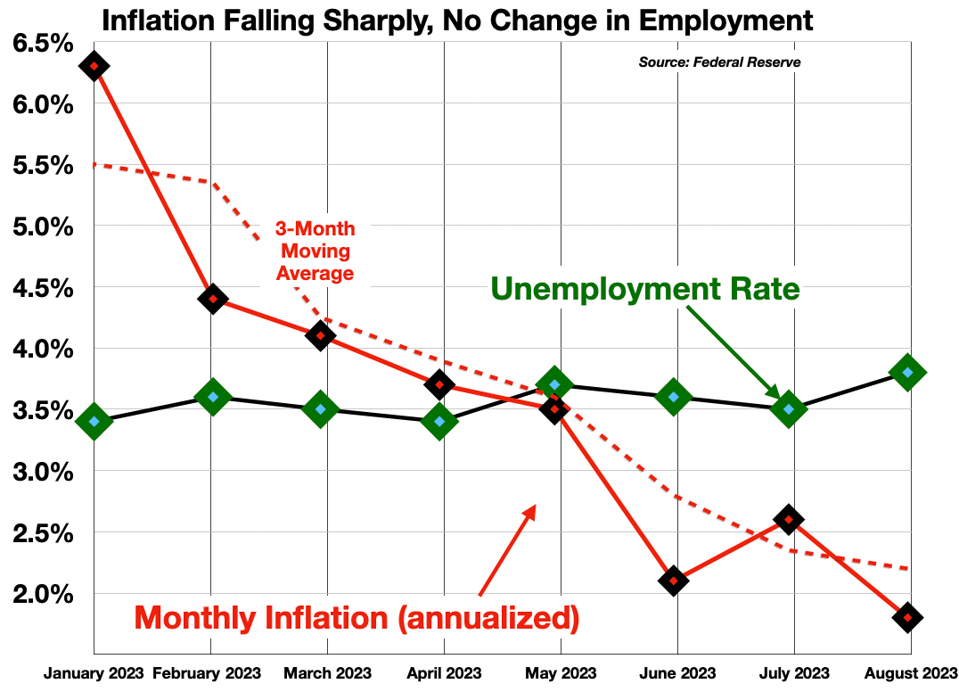
This contravenes the other stalwart of conventional wisdom on the cause of inflation: “wage pressure.”
The idea that labor costs are decisive in driving price increases is deeply rooted in mainstream economic theory. The (in)famous (and “unstable”) Phillips Curve treats labor market tightness as a central explanatory factor in inflation. It posits a trade-off – that is, an inverse relationship – between inflation and unemployment, such that low unemployment leads to tight labor market conditions, which embolden and empower workers to demand higher wages, driving up prices. If that were true, the current historically low unemployment should have sustained a much higher inflation rate. Which did not happen. Inflation came down as unemployment remained steady.
In its most virulent form, “wage pressure” becomes (in the minds of the theorists) the dreaded “wage-price spiral.”
- “Wage increases cause price increases which in turn cause wage increases, in a positive feedback loop.”
This inspires policy-makers to look for ways to increase unemployment, thereby reducing consumer demand and weakening labor’s ability to win further wage increases. This script – raising unemployment to reduce demand and “tame” inflation – has become scripture for many economic pundits. It was only a year ago that Larry Summers told us that:
- “We need five years of unemployment above 5% to contain inflation — in other words, we need two years of 7.5% unemployment or five years of 6% unemployment or one year of 10% unemployment.”
In the year since that dire pronouncement – a year marked by the most rapid monetary tightening program in American history – unemployment has remained essentially unchanged, “stuck” at the lowest level in history. The labor market is unhealthily healthy. Too many people have jobs, making too much money. At the same time, and against all expectations, inflation has plummeted, and essentially has now disappeared.
Even Prof Summers has had to at least scratch his head over this turn of events.
- “The inflation performance at this point is better than I think many standard models would have predicted.”
There’s actually a lot of head-scratching going on. The Economist, for example, asks “Why are the labour markets breaking the historical rule?” and, a bit ruefully, “Why aren’t more people being sacked?” [Such is the heart-cry of a disappointed orthodoxy.]
4. Deflation Is The Real Threat
The ultra-low PCE for August, taken together with several other metrics, points to the danger of deflation lurking around the corner.
The Producer Price Indexes (PPI) for commodities and for manufacturing have been falling and are now in deflationary territory.
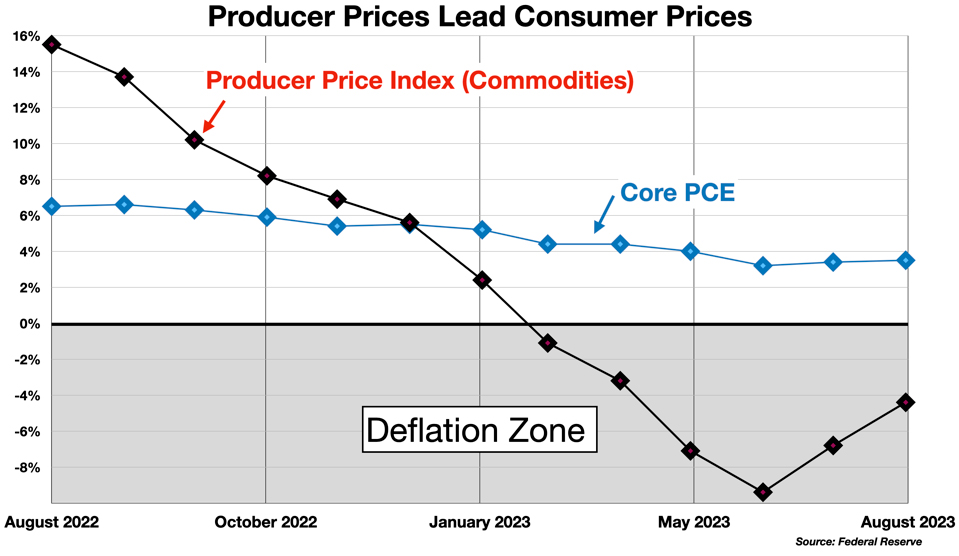
The PPI is a powerful leading indicator for the CPI and the PCE. Producer prices predict future consumer prices with extraordinary accuracy. The correlation of the producer prices with consumer prices 6 months later is almost 90%.
Meanwhile, the M2 measure of the money supply has gone negative for the first time in history.
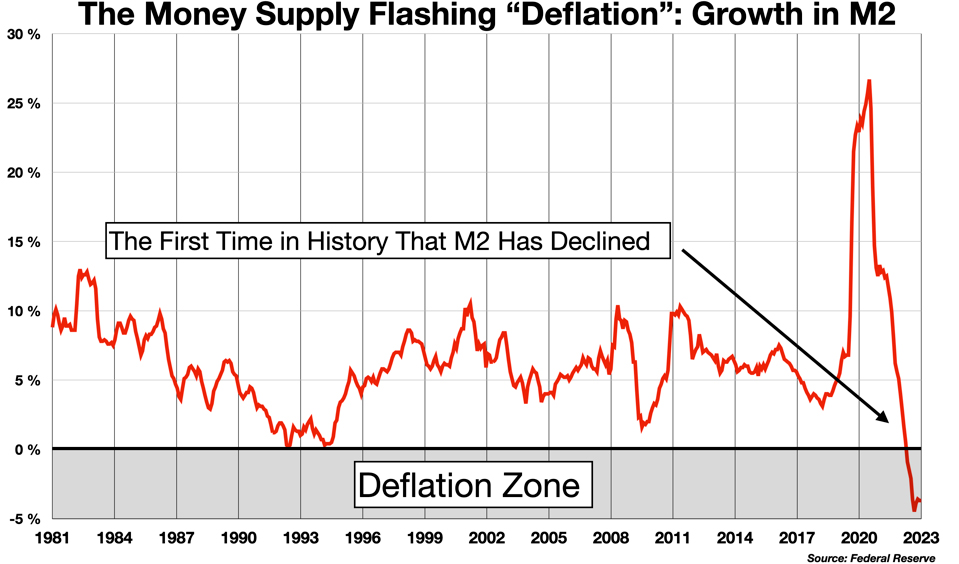
This is an alarming development. S&P Global has warned of a “deflationary spiral” leading to “economic starvation” –
- “If the money stock continues to fall, however, it could lead to outright deflation, where prices will start to generally decline and the rate of inflation will fall below 0% … Deflation, wherein inflation rates go negative and prices fall throughout the economy, can lead to diminished purchasing power and a rise in unemployment.”
Implications
What happens now depends on whether we accept, quibble, or deny the obvious conclusion: the Fed has been late to recognize the shift from inflation to disinflation/deflation. Its models and metrics did not pick it up.
On the side of acceptance, some observers are beginning to recognize that a change in our conceptions and preconceptions is called for.
- “The labor market’s persistent strength has surprised economists at the Fed, who have adjusted their unemployment forecasts down by half a percentage point, and those on Wall Street, where once-rampant recession predictions have been postponed or withdrawn. It has also forced a rethinking of the ingrained assumption that labor-market weakness is a necessary step to restore price stability.” – Barron’s (Oct 2, 2023)
Some regulators are also drifting towards the light –
- “Chicago Fed President Austan Goolsbee, in a speech Thursday [Sept 28], warned against allowing interest-rate policy to be guided too heavily by standard economic models that assume higher unemployment will be required to bring inflation down. ‘We need to be extra careful about indexing policy to this traditional view,’ he said. If the economy is behaving differently because of pandemic-driven distortions, following those traditional models would create a ‘serious risk of a near-term policy error,’ he said, using diplomatic jargon to signal alarm about overtightening.”
It would be a victory for humanity if one of the outcomes here were the abandonment of the cruel notion that in order to cure inflation it is necessary to cast millions of people out of work and into poverty.
In the quibble mode, there is still much fretting in the media and among policy-makers over whether the labor market is “too strong” to allow for a shift in monetary policy. (This is the “higher for longer” crowd.) The quibblers puzzle over the right measures of labor tightness, whether “job openings” is a better or worse indicator than, say, “quit rates”…
The role played by labor market conditions in giving rise to and sustaining price inflation is very front-of-mind at the Federal Reserve these days, which is worrisome. It often seems as though, faced with clear evidence that inflation is coming down in most segments, the Fed needs to find some hook on which to hang its case for higher rates, or “higher for longer” – and labor tightness has become that hook. This is not exactly the nihilism of Prof Summers’ 2022 pronouncements, but it is still a form of resistance to the idea that labor costs may not be the real problem.
Then there are the Disinflation/Deflation Deny-ers –
- “Federal Reserve Bank of Cleveland President Loretta Mester said the US central bank will likely need to raise rates once more this year and then hold them at higher levels for some time to get inflation back to its 2% target…. Mester said the rate of inflation remains too high… She said rising gas prices resonate strongly with consumers, who could expect inflation to start accelerating again.”
“Inflation remains too high”? This is obtuse.
Depressingly, many in the Deny-er camp still occupy positions of authority, either in the public media, or at the Fed and other central banks, where they still have the power to cause real suffering through their misguided pronouncements and bad policy decisions. We can hope that their influence is eroding as the disinflationary/deflationary picture becomes clearer.
Follow me on Twitter or LinkedIn.
About the Author:
Dr. George Calhoun, a graduate of the University of Pennsylvania, received his Doctorate Degree from the Wharton School of Business. He has served in multiple capacities in the Financial Sector and in the Wireless Communication Industry. He has authored multiple articles on subjects of interest to him and several books. His most recent book “Price & Value: A Guide to Equity Market Valuation Metrics” is available through the Publisher Springer/Aspress. Dr. Calhoun currently serves as the Executive Director of the Hanlon Financial Systems Research Center at the Stevens Institute of Technology and is an Advisory Board Member of Vestbridge Advisors, Inc.
Vestbridge Advisors, Inc. (“VB”) Is registered with the US Securities and Exchange Commission as a registered investment advisor with principal offices at 3393 Bargaintown Road, Egg Harbor Township, NJ. The information contained in this publication is meant for informational purposes only and does not constitute a direct offer to any individual or entity for the sale of securities or advisory services. Advisory advice is provided to individuals and entities in those states in which VB is authorized to do business. For more detailed information on VB, please visit our website at www.Vestbridge.com and view our Privacy Policy and our ADV2 Disclosure Document that contains relevant information about VB. Although VB is a fairly new organization, any references herein to the experience of the firm and its staff relates to prior experience with affiliated and nonaffiliated entities in similar investment related activities. All statistical information contained herein was believed to be the most current available at the time of the publishing of this publication.