
2024 Outlook
January 19, 2024
Introduction
If one were to rank the biggest drivers of stock market performance in 2023, mega-cap dominance and the missing recession would likely be atop the list. The Magnificent Seven (“Mag 7”) stocks – Amazon, Apple, Alphabet, Meta, Microsoft, Nvidia, and Tesla – provided the bulk of US stock returns during the entire year, with the market gains only beginning to broaden out in the final quarter. Much of the Mag 7 outperformance was attributable to a bounce back from their underperformance in 2022, but they also found favor due to their financial stability relative to other stocks as investors waited on a Fed-induced recession. Also, it didn’t hurt that they each have considerable exposure to Artificial Intelligence (AI), the two most important words in investing in 2023.
Economists and financial industry experts were quite confident that the US would experience a recession in 2023, with Bloomberg’s touted probability model proclaiming a 100% chance of recession within one year of October 2022. Bloomberg was not alone, as nearly two-thirds of economists polled by the World Economic Forum anticipated a recession in 2023. When we issued our 2023 Outlook one year ago, we raised the possibility that full employment could keep the US economy afloat and avoid a recession, although US GDP growth was above our forecast. Our thesis that full employment would likely persist through the year proved accurate and consumer-driven GDP growth clocked in at 4.9% in the third quarter and is estimated to come in above 2% in Q4, an incredibly strong growth rate against the backdrop of a 5.25%-5.5% Fed Funds rate. The economic strength has bought the Fed additional time to keep rates pinned higher and watch inflation data slowly but steadily decline.
Now the Fed must balance its desire to attain 2% inflation against the risk that delaying rate cuts inadvertently brings about the recession it has thus far been fortunate to avoid. Markets are eagerly looking ahead to the days when the focus will shift to corporate earnings and fundamentals and away from macroeconomic interest rate and inflation data. Essentially, investors are ready for the Fed to step away from the spotlight and return to their traditional, less prominent role behind the scenes.
It has been a long time since things felt “normal” in the economy. A global pandemic, multiple wars, political dysfunction, supply chain bottlenecks, rampant inflation, and extreme central bank intervention have made the past several years a challenge for investors seeking to apply traditional valuation metrics to the markets. While there is no guarantee we finally have complete resolution on any of these complexities – or that new ones won’t emerge – we are optimistic that the market is now trending towards a state of “normalcy” that will refocus on company fundamentals rather than central bank handouts.
Economic Backdrop
We are optimistic that the elusive “soft landing” is possible, but it will require the Fed easing off the throttle, hopefully around the end of the first quarter. A quarter point rate cut in March would be a sign of confidence in the recent inflation data, which has shown prices moderating. For this optimistic timeline to transpire, however, the monthly data leading up to the March meeting will have to show inflation at a near-zero rate. As the below chart demonstrates, the monthly data points for the Fed’s preferred inflation measure, Core Personal Consumption Expenditures (PCE), have been 0.1% in four out of the last five months. If we annualize the most recent quarter’s data, Core PCE inflation has been running at 2.0% lately, which is on target with the Fed’s goal.
Exhibit 1. Monthly Core PCE Inflation and 3-Month Annualized Rate
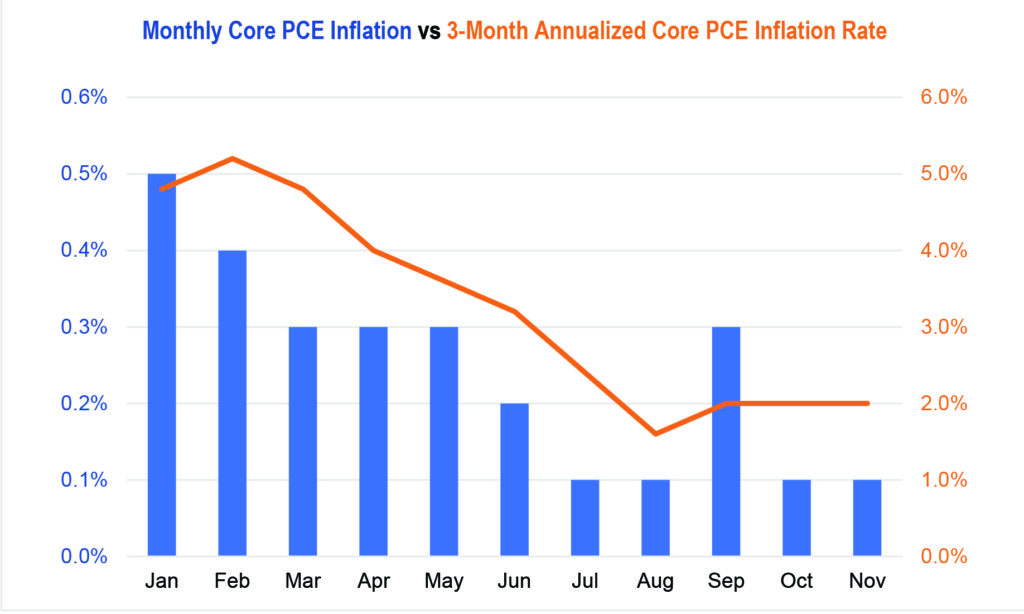
The 2% three-month annualized reading looks much better than the 12-month trailing inflation rate of 3.1%, because the data is skewed with most of the hot inflation readings occurring in the early months of that calculation. The Fed is unlikely to budge on rates until it can point to evidence that the 12-month measure is closer to 2%, but this could possibly occur by March if Core PCE continues to come in around 0.1% monthly. Producer Price data (PPI), which can be considered a leading indicator for consumer price inflation, has fallen into deflationary territory in the most recent quarter. The annual rate of PPI is presently 1.0% and the three-month annualized rate is -2.4%.
While the Core PCE trend is clearly downward, it is very likely that there will be hiccups along the way, such as the 0.3% September reading in the above chart. The Cleveland Fed’s “Inflation Nowcasting” model predicts the next two monthly data points to be around 0.25% (equal to an annual 3% inflation rate), which would push back the timeline for annual Core PCE hitting 2% or less. So, while March is on the table, a more conservative view would be for a second quarter “mission accomplished” moment on the inflation front. As of this writing (1/18/24), the market is pricing in around 55% probability that the Fed cuts in March, which is likely a bit aggressive because the Fed will meet prior to the March PCE data release. Therefore, there are only two opportunities for Core PCE to surprise to the downside and convince the Fed to cut rates in March.
Of course, the Fed’s messaging can move markets just as much as its actual policy actions, so even if the Fed holds in March, it can convey a dovish message at the quarterly meeting via its “Dot Plot” summary of interest rate projections. As we saw in December, the Fed’s resolve in keeping interest rates “higher for longer” is far from iron clad. The central bank’s projections for rates in 2024 and 2025 were increased in September only to be reversed at the December meeting. It’s possible that the Fed’s view will moderate to align more closely with the market’s anticipation of steeper rate cuts, given the decelerating inflation presently occurring.
Exhibit 2. Changes in Median Federal Reserve “Dot Plot” Summary of Interest Projections
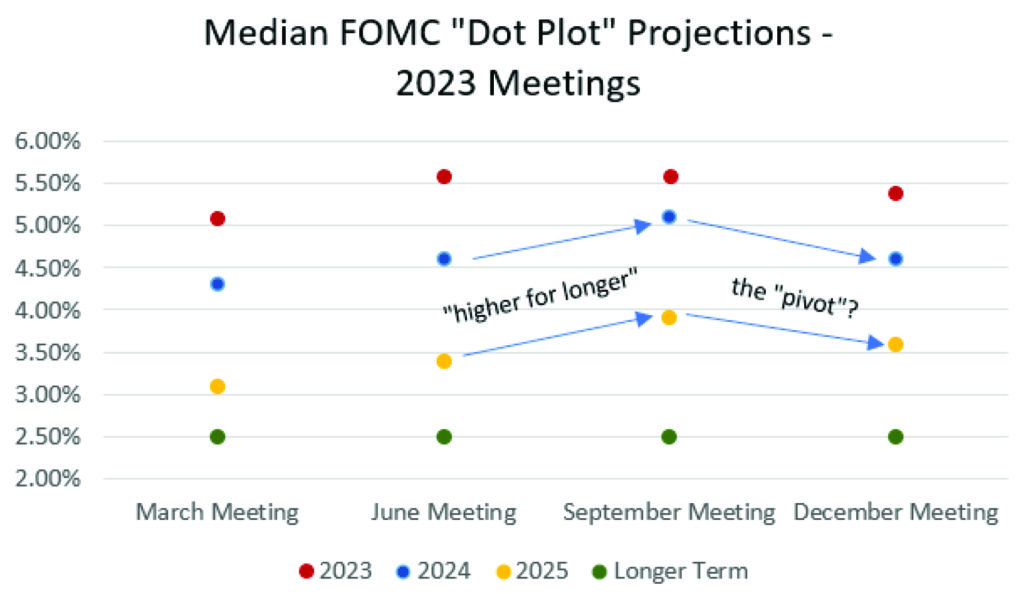
As the Fed’s December policy meeting minutes revealed, some members are beginning to grow concerned that its “overly restrictive stance” could create “downside risks to the economy.” The most obvious risk would be a systemic banking system failure, a more widespread version of the regional bank failures from March 2023. Balance sheet exposure to distressed commercial real estate and low-yielding, long-term Treasuries will continue to weigh on the banking sector until Fed rate cuts are underway. Keeping the banking sector healthy is likely the biggest impetus for the Fed to begin lowering rates, as the economy otherwise looks plenty capable of handling a “higher for longer” policy stance.
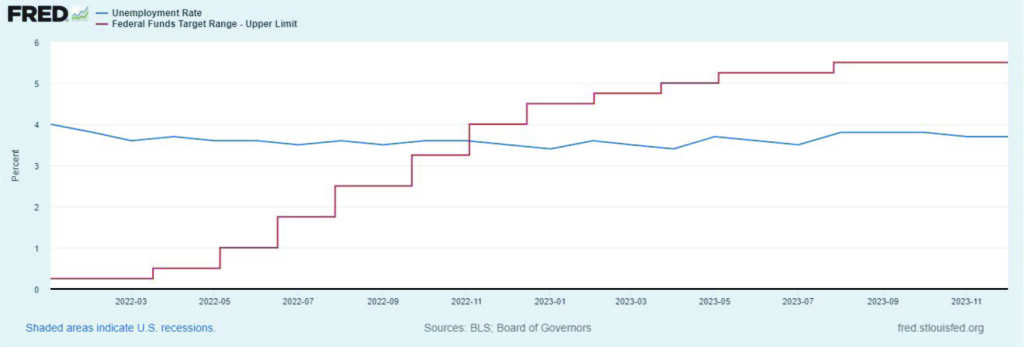
The strength of the economy is best conveyed by the unemployment rate, which has remained below 4% for the entirety of the Fed rate hike cycle. Heading into the year, the Congressional Budget Office (CBO) estimated unemployment would range between 3.8% to 6.4% in 2023. Similarly, the CBO’s Survey of Professional Forecasters consensus was for a 4.0-5.0% unemployment rate by year-end 2023. Yet as we begin 2024, unemployment remains at only 3.7%. In 2024 it’s still too early to expect advances in Artificial Intelligence (AI) to make some jobs obsolete, but that eventuality should start in 2025. Post-pandemic, laid-off workers have had no difficulty in finding replacement jobs, as the early retirement of the baby boomers and travel restrictions on skilled immigrants created a shortage of workers for many industries. Whether the AI boom will resolve the existing demographic challenges remains to be seen, but it is evident that thus far, the Fed’s rate hikes have been ineffective in deterring businesses from hiring.
Exhibit 3. Unemployment Rate and Federal Funds Target Range – Upper Limit
The other major opposing force to the Fed’s rate hikes is government spending, which has become a hotly debated topic and will no doubt remain so during the election year. Simply put, the Federal government has become addicted to spending. Whether it’s to stimulate growth or just traditional political pork geared towards endearing votes is debatable. Much of the post-pandemic job gains have been replacement workers hired to replace federal employees who opted for early retirement during the pandemic, and now the number of government workers exceeds pre-pandemic levels. We wrote a market
commentary a couple months back positing that inflation now is being propagated by the federal government spending, yet, another arm of the government, the Federal Reserve, is fighting that inflation. What a bad way to run an economy and country.
Exhibit 4. Total US Government Employees
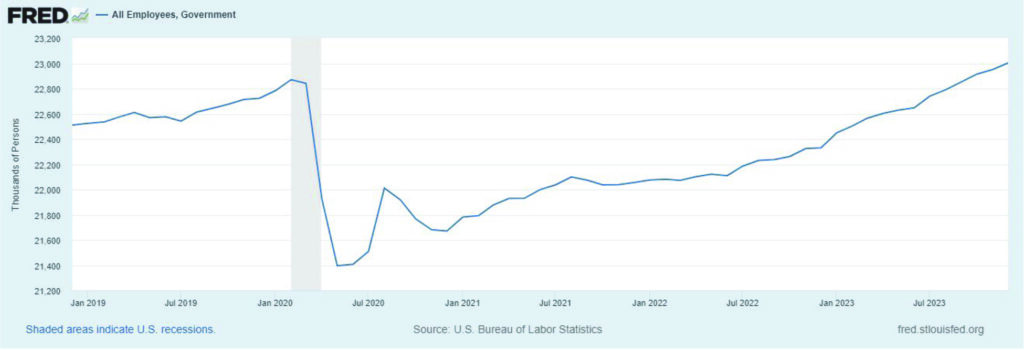
Not only is the government spending more than ever, but income tax receipts are also down as the result of the Trump-era corporate tax cuts. This growing deficit, and Congress’ inability to deal with it through repeated debt ceiling showdowns, has cost the United States its top-tier credit rating and threatens to raise the cost of servicing the growing debt burden. While the Fed would like to maintain rates at present levels for the first half of the year, one must wonder how long before lawmakers start pounding the table for rate cuts to make their spending spree more palatable to the American people
US Equity
As previously mentioned, the big story of 2023 was the concentrated outperformance of the Mag 7 stocks. In 2024, the likely theme will be the broadening out of participation to encompass the less engaged parts of the stock market such as Value stocks and Small and Mid-Caps. In 2023, Small Cap stocks didn’t make investors any money until mid-November and remain significantly undervalued by traditional Price-to-Earnings (P/E) metrics. At just 14.5 times forward earnings, the P/E Ratio of the S&P 600 Small Cap Index is at roughly a 25% discount to that of the S&P 500 (trading at 19.5x forward Operating Earnings), the largest relative undervaluation since the Dot-Com bubble.
The reason for the underperformance of Small and Mid-Cap stocks is their greater reliance on debt and a general flight to the safety of the biggest Large Cap stocks and their fortress-like balance sheets, not to mention their excellent actual and projected growth rates. If the Fed can engineer the soft landing as anticipated, Small and Mid-Cap stocks will gain access to cheaper sources of borrowing and should be able to outperform their larger peers considering how far behind they have fallen post-pandemic.
In the domestic Large Cap space, a similar broadening out beyond the concentrated Mag 7 leadership is a likely theme in 2024. Financial stocks are trading at 14.5x forward earnings per Standard and Poor’s estimates, providing an attractive entry point as demand for loans should increase as rates eventually fall. Buying some of 2023’s other losers – Healthcare, REITs, Consumer Staples, Utilities – is a reasonable position to take heading into 2024 since they are defensive if economic conditions unexpectedly deteriorate but also should perform well in a risk-on environment as investors seek to diversify away from the overweight positions that accumulated in 2023.
Stepping back and looking at Large Caps as a whole, the move in the S&P 500 has been swift since November and has some questioning whether it was too far, too fast. A cooling-off period would not be surprising as the market and the Fed work out their disagreements regarding the timing of the first rate cut. But ultimately, we see a clear path towards 5,000+ on the S&P 500, which would be a 20.7x P/E multiple based on current Operating Earnings estimates for 2024 from Standard and Poor’s. Coincidently, the S&P 500 average P/E multiple (using Operating Earnings per Standard and Poor’s) over the last 10 years is 20.7x.
With the US at the forefront of technological innovation, investors will likely be willing to pay an even higher multiple as the true potential of AI and other advances are unlocked. S&P 500 at 6,000 may sound excessively bullish, but if earnings grow at the expected 13% in 2024 it would take an additional 20% growth rate in 2025 to hit S&P 500 6,000 at a 20.7x multiple. If AI delivers on the promises, this bullish outcome could become a possibility when the market focus shifts towards forward earnings for 2025. We project S&P 500 hitting 6,000 by year end 2026/early 2027 at the latest.
Developed International Equity
On the surface, international stocks remain a relative bargain to their domestic counterparts, trading at a P/E multiple around 12x forward earnings, roughly where they began 2023. The European Central Bank looks poised to follow the US Fed’s lead in gradually lowering interest rates, but the Eurozone has fundamental challenges in managing inflation across a diverse coalition of member nations. Germany, which for years has kept the Eurozone afloat, is the only G7 economy projected to have shrunk in 2023 and forecasts for 0.9% growth in 2024 are below those of other developed economies.
Diversification for long-term investors remains advisable given the low valuations but we could be looking at yet another underwhelming year for Developed Market (DM) equity. The biggest looming risk remains the Ukraine war, the potential for escalation, and a potentially tenuous energy supply situation. The war also provides the biggest potential upside risk as well, however, as a resolution or leadership change in Russia would resolve the biggest uncertainty threatening the region. For now, the war appears to be a slow grind but with the US public growing tired of funding two major geopolitical conflicts, the risk of escalation has never been greater.
The bright spot for DM, and potential driver of outperformance, is Japan, which broke out of decades-long slump in 2023 with a 28% gain, besting the S&P 500’s 26% return. Even after the impressive run-up, Japanese equities are likely to post another solid year thanks to corporate regulatory reforms and low inflation relative to the rest of the globe that has enabled continued dovishness from the central bank. Japan is also benefitting from demand for semiconductors and related electronics as trading partners seek to distance themselves from an increasingly isolated and unpredictable Chinese regime.
Emerging Markets
China represents roughly 25% of the market capitalization of the Emerging Markets (EM) region, but its influence on EM performance is far greater due to its role in global trade. For years, investors have eagerly awaited the rise of the Chinese middle class and the opening of the mainland economy to global business partners. Yet year after year, investors have been disappointed by a restrictive and unpredictable Communist regime and China has essentially been dead money for outside investors for over a decade.
Consider the iShares China ETF (MCHI), which launched in March 2011. If you invested at launch, the total return on your investment after nearly 14 years would be -3.6% as of January 10, 2024. During the same period, the S&P 500 rose 362.7%. It is understandable why many investors have decided to finally write off China as “uninvestable”. Perhaps 2024 will be the rock bottom moment, as the outlook for the Chinese economy is as dire as ever in recent history.
China is facing systemic challenges that will take major reforms to overcome. The most pressing is the downturn in the debt-fueled property sector, which previously accounted for roughly a quarter of the nation’s economic growth. For decades, the government aggressively promoted property development to meet demands of population growth. A “shadow banking” industry emerged, and highly leveraged property developers have fallen into ruin, threatening to default on debt estimated to be nearly $400 billion.
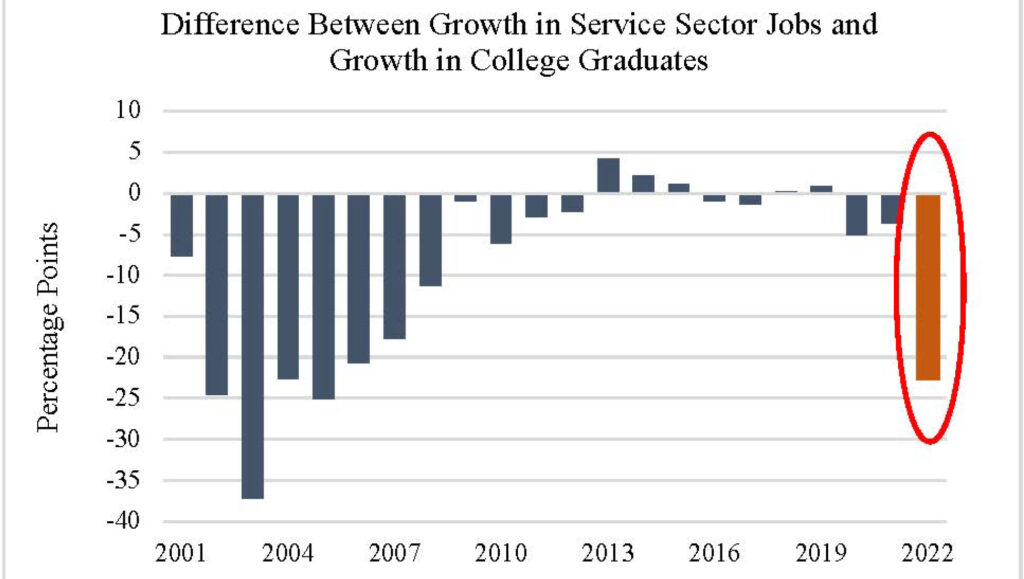
China also faces demographic imbalances, the outcome of years of “one-child” policy from 1979-2015. The country has one of the lowest birth rates in the world and an ageing population. Young people are hesitant to start families with uncertain employment prospects and the youth unemployment rate soared to 21.3% in June, prompting the government to cease reporting the data. Young people in China are increasingly more educated but there are insufficient skilled service sector job opportunities, prompting many to leave the country for better opportunities overseas.
Exhibit 5. China – Growth Gap between Service Sector Jobs and College Graduates
After being burned by China for so many years, some investors are looking for ways to invest in the rest of EM without exposure to China. The iShares MSCI Emerging Markets ex-China ETF (EMXC) gained 19% in 2023 while the broader EM EFT (EEM) was up just 9%. China’s challenges represent opportunity for competing EM countries, with India being the most obvious beneficiary.
For long term investors, it is a tough sell to recommend owning emerging markets, but we continue to recommend keeping some exposure as we enter a period of declining interest rates. Inflation is falling faster than in the US for many EM countries, which will facilitate more aggressive rate cuts than in the US. Lower rates mean lower cost of capital for business expansion and some of the money parked in US Treasuries should eventually flow back overseas as investors seek higher potential return on investment.
Fixed Income
The yield curve has been inverted since July of 2022, supporting the calls last year for a recession. With yields on ultra-short duration Treasuries yielding over 5% for most of the year, deposits in money market funds reached a record $6 trillion in 2023. On the longer end of the yield curve, the 10-Year Treasury is trading back where it started in 2023, near 4%, after a brief trip to 5%, a level that looks unlikely to be revisited any time soon. With the Federal Reserve announcing rate cuts a near certainty in 2024, there is downward pressure on the long end of the yield curve with investors seeking to lock in rates before they fall.
Presently, the 10-Year US Treasury yield at 4% looks out of sync with its global peers and we believe that the differential will resolve via a downside move in the US 10-Year rather than an uptick in foreign counterparts. Consider that investors are demanding a higher rate for US Treasuries than those of Germany (2.2%), Italy (3.7%), and Spain (3.1%). Despite congressional dysfunction and spiraling debt, the US economy is arguably on better economic footing than those European countries and poised to continue GDP growth outperformance in the coming years. Once markets have clarity from the Fed, rates should, after already declining from their 2023 peaks, decline further on US Treasuries across the yield curve.
For tactical portfolios, our preference in 2023 was to hold short term government bonds along with high yield debt based on our view that recession fears were overblown. With rates poised to fall, shifting up the yield curve in fixed income allocations makes sense in 2024. Corporate bonds, both investment grade and high yield, look attractive in anticipation of the first Fed cut. High yield bonds have outperformed most analysts’ expectations with a better-than-expected level of defaults through the pandemic, recovery, and interest rate hike cycle. Corporate bond defaults have crept up slightly to end 2023, but at 4.1% are only just reaching the historical long-term average rate.
Exhibit 6. Trailing-Twelve-Month Default Rate, US High Yield Bonds

Assuming we dodge a recession, high yield bonds will also find favor as investors seek alternative sources of yield in a falling interest rate environment. With money markets providing 5-5.5% yields, many investors were content to collect income from that risk-free asset class. Slowly, in the coming year(s), that money market rate will decline, and become less attractive of an investment. Floating-rate Bank Loans also attracted strong interest thanks to their superior interest rates which rose as the Fed hiked. With rates on the downtrend, these options will be less attractive and high yield bonds will again fill their traditional role as an income-generating middle ground between investment grade bonds and stocks.
Commodities and Alternatives
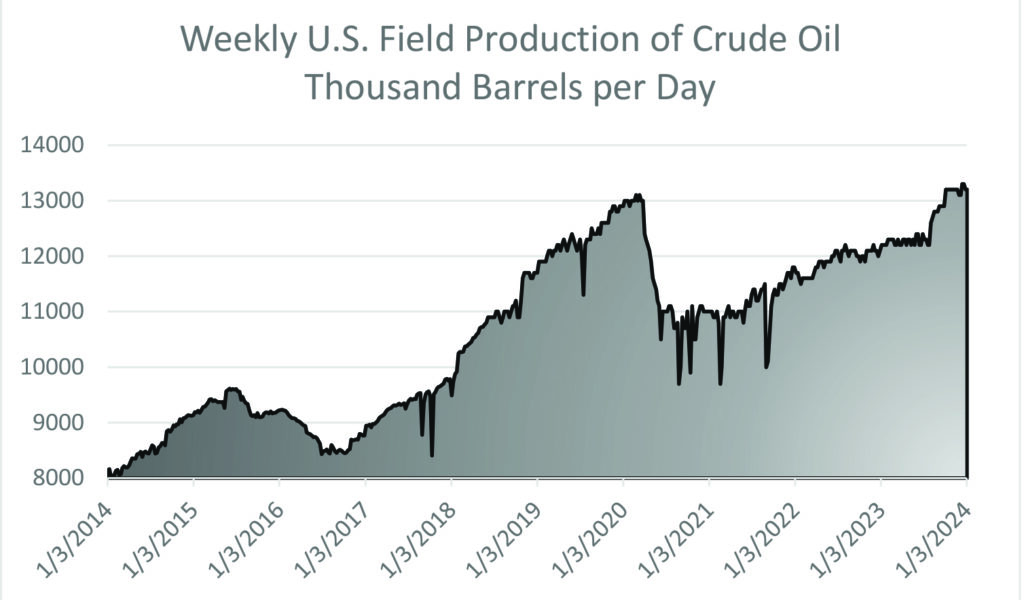
Oil and related energy stocks were the standouts of 2022 but quickly became laggards in 2023. Despite continued uncertainty due to the Ukraine war, oil was unable to meaningfully breakout to the upside in price and ended the year lower at around $70 a barrel for US West Texas Intermediate. The low prices were attributable to US record-setting domestic oil output. Despite the narrative that US oil companies are being restricted by the Biden Administration’s clean energy initiatives, US drillers pumped out crude at previously unseen levels, including record-setting shale oil production from fracking in 2023.
Exhibit 7. Weekly US Oil Production Rate
With conflicts now raging in both Ukraine and Israel threatening both European pipelines and Red
Sea shipping lanes, energy commodities should not decline further in 2024, also supported by a continued strong domestic economy. The US government was also an active buyer of crude in 2023 which supported the price, as the government replenished the strategic oil reserve at a profit by buying crude at $79 a barrel after selling reserves in 2022 at $95.
Aside from Energy, Real Estate looks poised for a bounce back in 2024 as well, despite the challenges facing the commercial property sector. Office REITs will likely continue to underperform amid high
vacancies as remote working trends appear to be entrenched. However, real estate is a diverse sector
and other subindustries within the sector should benefit from falling rates. As was the case with high yield bonds, when risk-free government bonds offer returns of 5% or more, they become relatively more attractive to income-seeking investors who typically look to REITs to provide higher income streams. With rates poised to fall, REITs will regain some of their appeal, as was seen in Q4 2023.
Final Thoughts
The “soft landing” has been achieved, although much of the credit should go to the US consumer for keeping the economy afloat during the rate hike cycle. Considering the lack of impact on unemployment from rate hikes, it can be argued that the Fed’s policy tools were ineffective; inflation just needed time for lingering bottlenecks and pent-up demand to work its way through the system. Inflation is clearly trending lower in the near term and recent trends suggest it is time for the Fed to step aside and ease rates. From the beginning of the rate hike cycle, we cautioned of the risk of an overly restrictive policy stance triggering an unnecessary recession. We also put cautious trust in the Fed’s promise to be “data driven” in making policy decisions. The data is clearly trending towards an inflation rate that aligns with the Fed’s 2% target. All that remains for the Fed to do is get out of the way and let the US economy run uninhibited.
Read the Forbes article – Here
Vestbridge Advisors, Inc. (“VB”) Is registered with the US Securities and Exchange Commission as a registered investment advisor with principal offices at 3393 Bargaintown Road, Egg Harbor Township, NJ. The information contained in this publication is meant for informational purposes only and does not constitute a direct offer to any individual or entity for the sale of securities or advisory services. Advisory advice is provided to individuals and entities in those states in which VB is authorized to do business. For more detailed information on VB, please visit our website at www.Vestbridge.com and view our Privacy Policy and our ADV2 Disclosure Document that contains relevant information about VB. Although VB is a fairly new organization, any references herein to the experience of the firm and its staff relates to prior experience with affiliated and nonaffiliated entities in similar investment related activities. All statistical information contained herein was believed to be the most current available at the time of the publishing of this publication.