

What’s Up In The Market
Week Ending October 4, 2024
Weekly Market Summary
Global Equities: Stocks got more good news from the Friday jobs report, which provided confidence to investors that the Federal Reserve may be reigning in inflation without triggering a recession. Before the jobs report, equities looked a bit shaky, and the S&P 500 ultimately ended the week up just 0.3%. The Dow Jones Industrial Average and Nasdaq Composite both closed the week up 0.1%. Small Cap stocks were down -0.5% during the week. Developed International stocks were laggards for the weekly session, down -1.6%, while Emerging Markets continued to lead with a 0.8% weekly return.
Fixed Income: The 10-Year Treasury shot up on Friday to near 4% as investors pared back rate cut expectations amidst strong jobs data. With recession looking less likely, investors favored equities over bonds. Despite the strong economic news, High Yield bonds slipped during weekly trading, down -0.5%.
Commodities: US West Texas Intermediate Crude oil prices rose during the week, with US West Texas Intermediate crude trading around $73.60 on Friday afternoon. Middle East tensions have outweighed the glut of oil currently being pumped by the United States and the expectation of additional supply from Saudi Arabia as it is set to abandon self-imposed production cuts.
Weekly Economic Summary
Jobs Report: US employers added 254,000 jobs in September, vastly eclipsing expectations for a gain of 140,000. Unemployment ticked lower from 4.2% to 4.1%. The strength of the jobs market rebound once again gives the Fed rationale to go slowly on rate cuts, which means the November cut could likely be just 25 basis points rather than a second 50 basis point cut.
Housing Market Still Stuck: The Fed’s September rate cut gave homebuyers some relief in the form of lower mortgage rates, which led to a surge in refinancing activity. However, the lack of housing inventory has kept the housing market stuck in the mud, with weekly mortgage applications falling -1.3% during the week and refinancing applications -2.9%. After the strong jobs data pushed the 10-year yield higher, investors should expect more weak demand for mortgages in the near term.
Earnings Preview: Third quarter earnings will commence Friday, October 11th with JP Morgan (JPM), Wells Fargo (WFC), BlackRock (BLK) and Bank of NY (BK) set to report. Per FactSet, third-quarter earnings are expected to grow at just 4.2%, however fourth-quarter earnings are expected to increase by 14.6%, year-over-year.
Chart of the Week
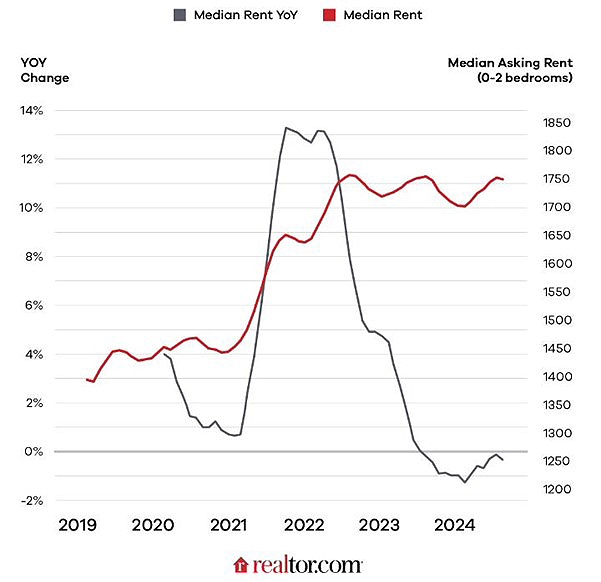
The Chart of the Week looks at the median rent price for a two-bedroom apartment in the US. Rental prices are used to compute shelter inflation, along with survey-based “Owners’ Equivalent Rent” which asks homeowners how much they would need to pay to rent similar housing. While the year-on-year rate of change has fallen to slightly negative, the overall impact of the pandemic is evident in the median rent price which remains more than $200 a month more costly. Shelter is a major contributor to inflation data and has yet to decline as rapidly as other components.
Vestbridge Advisors, Inc. (“VB”) Is registered with the US Securities and Exchange Commission as a registered investment advisor with principal offices at 3393 Bargaintown Road, Egg Harbor Township, NJ. The information contained in this publication is meant for informational purposes only and does not constitute a direct offer to any individual or entity for the sale of securities or advisory services. Advisory advice is provided to individuals and entities in those states in which VB is authorized to do business. For more detailed information on VB, please visit our website at www.Vestbridge. com and view our Privacy Policy and our ADV2 Disclosure Document that contains relevant information about VB. Although VB is a new organization, any references herein to the experience of the firm and its staff relates to prior experience with affiliated and nonaffiliated entities in similar investment-related activities. All statistical information contained herein was believed to be the most current available at the time of the publishing of this publication.


Ready to learn more about
smart, personalized investing?
Your portfolio should always reflect your ambitions, your values, and your story. At Vestbridge we start from scratch with every single client and we create a smart personalized portfolio that is unique to you. Talk to a Vestbridge Financial Advisor today.
Schedule A Consultation