
2022 Q4 Quarterly Report
Economic Commentary
The fourth quarter of 2022 continued the year-long theme of stubbornly persistent inflation, with some investors caught off guard by the Federal Reserve’s (“the Fed”) resilience in continuing to hike rates in the face of rising recession risk. The Fed Funds target rate is now at 4.25%-4.50%, up from 0.00%-0.25% at the beginning of the year. Despite glimmers of easing inflation, the Fed has shifted to a more aggressive tone during the final quarter, bringing its target terminal rate up to 5.0-5.25% with no rate cuts in 2023. The market’s expectations, however, as implied by Fed Funds Futures, are that the Fed will only be able to hold rates above 5% for roughly 4 months before reversing course in September.
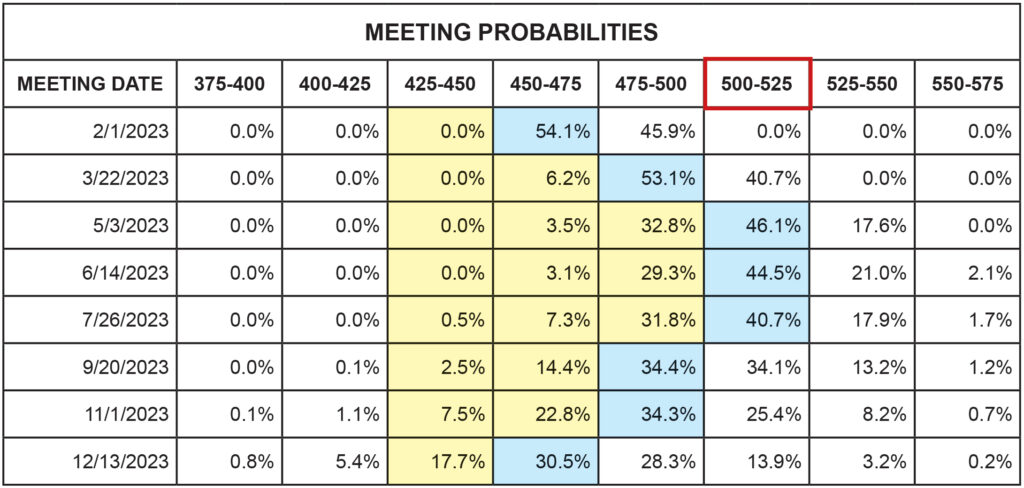
Exhibit 1: Fed Funds Futures probabilities favor terminal rate of 5.0%-5.25% for 2023
It’s important to understand the difference between the Fed pausing on rate hikes vs actively cutting rates. The Fed typically targets a “neutral” level in which its policy rates neither accelerate nor restrict growth. High inflation dictated the need for the Fed to push beyond neutral and actively constrain growth, but the debate remains whether the Fed should be slowing down or even pausing to allow its decisions to work through the economy or keep its foot on the gas and throttle inflation at any cost. Those in favor of a slower rate increase pace or even a pause would argue that the inflation data driving the Fed’s decisions needs time to catch up; lots of the measured data are lagging. Those favoring continued hawkishness counter that inflation cannot cool until wage pressures ease, therefore the Fed must push the economy into recession and assure increased unemployment, it being a lesser evil to runaway inflation.
The Fed Funds Futures market is telling us that there are two possible ways the Fed could be swayed from ending 2023 at its forecasted range target of above 5%. The first path is if inflation data continues its recent trend in softening through the first quarter. There is no Federal Open Market Committee (FOMC) meeting in January so several soft inflation readings prior to the February 1st FOMC meeting date could allow the Fed to lessen rate hikes to just 25 basis points. Markets currently assign a roughly 54% likelihood to a 25 bp February hike. This would set up a 25 bp rate hike in March and allow the Fed to wait for more inflation data as well as the April 27th GDP release before May’s meeting, at which time the Fed could declare “mission accomplished” and hold rates at 4.75-5.0% for the remainder of the year. The implied probability of this outcome is roughly 36%.
The less desirable path to a sub-5% year-end rate is one in which the Fed maintains its heavy-handed approach with a 50 bp hike in February followed by a 25 or 50 bp increase in March. This would hit the Fed’s target above 5% prior to the May meeting. The risk here is that easing inflation data lags the Fed May decision, and the FOMC hikes rates in May above 5.25% as some Fed officials have called for. Weak GDP data combined with a sudden drop off in inflation thereafter would raise concerns that the Fed went too far, in which case pressure could quickly mount for the Fed to reverse course and undo its rate hikes to ease back below 5%. This would be an embarrassing outcome for the Fed and decrease confidence in the central bank’s ability to effectively implement policy controls. An even worse scenario is if inflation remains elevated while GDP weakens, leaving the Fed powerless in a “stagflation” environment, characterized by low or negative growth amidst rising prices.
Whether we get the first or second outcome is going to depend on inflation data. Fed Chairman Jerome Powell has sought to define his approach as “data driven”. The question now is whether the data is timely enough to paint an accurate picture of reality, or whether it is simply a lagging view of the past and ineffective for making current policy decisions; decisions which can only affect the future and have no bearing on curing past inflation. The Fed has a multitude of data sources, and one would presume they are keenly aware of any potential shortcomings; however, there is some concern that the Fed may be underestimating the damage already done to arguably the most critical component to inflation, housing.
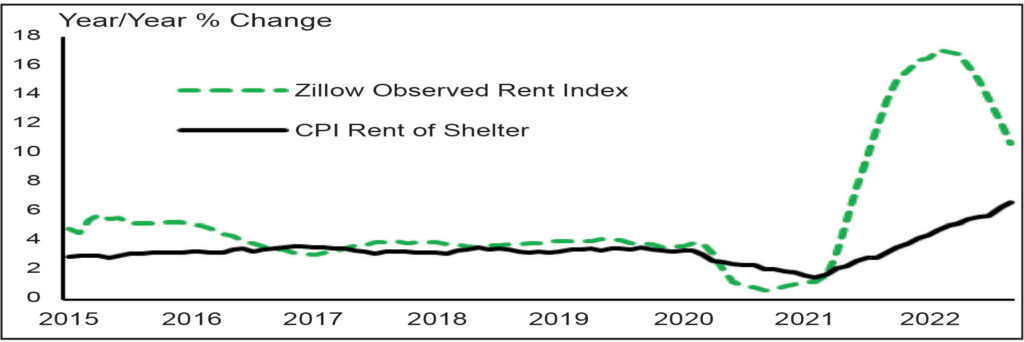
“Shelter” comprises 33% of the headline Consumer Price Index (CPI) and 42% of the “core” CPI (ex-food and energy). The problem with the shelter data is that it relies on lagging surveys to quantify the cost of rents and owner-equivalent rents (the cost homeowners would pay to rent a similar dwelling). The lag on these survey-based metrics is significant because the surveys are infrequent and because rental leases are typically annual and may not yet reflect reality. If we look at more real-time measures, like the below Rent Index provided by Zillow, we can see that rents are on a sharp downward trend despite the CPI shelter component still trending upward.
Exhibit 2: CPI Shelter Component vs Zillow Observed Rent Index
To its credit, the Fed has begun to increasingly mention the “lagging effect” of certain indicators, but its policy decisions and dot plot rate forecasts do not indicate a willingness to wait for the lagging data to catch up, which most economists believe won’t occur until mid-2023 at the earliest.
When the data does finally catch up, we anticipate an official reading of negative inflation, otherwise known as deflation, but this moment is probably Q3 or Q4 of 2023, five or six FOMC policy meetings away. For the time being, the biggest risk remains an overzealous Fed needlessly plunging the economy into a deep recession, unaware the inflationary tide has already turned.
Market Commentary
The fourth quarter began with global equity markets at year-to-date lows, coming off a September swoon triggered by Fed Chairman Jerome Powell’s hawkish Jackson Hole meeting speech. The S&P 500 Index and Dow Jones Industrial Average (DJIA) were able to bounce off these levels, however, thanks to solid earnings reports in October. The Nasdaq, on the other hand, has yet to get off the mat and remains trapped in a sideways pattern, with occasional strong surges met with equally intense selling. At years’ end, the value oriented DJIA is the best performer of the three major US indices, limiting losses to single digits at -6.9%. The S&P closed out the year with a -18.1% decline, while the tech-heavy Nasdaq was down a devastating -33.1%.
As mentioned, corporate earnings have been mostly positive despite the obvious challenges of inflation and recovering supply chains. In the third quarter, 68% of S&P 500 companies beat estimates while roughly 25% missed. The miss rate was the highest since the pandemic-impacted first quarter of 2020, but not extreme considering lingering, yet abating, supply chain issues. Given the significant underperformance of the Nasdaq, one would expect poor earnings reports from the technology sector, but it posted the lowest earnings miss rate at just 13%, with roughly the same percentage matching estimates and 73% of tech companies beating their forecasted earnings.
Looking ahead to 2023, Standard and Poor’s forecasts forward operating earnings of $227.17 per share for the S&P 500 Index, which has been revised down 5% since September 30th. We believe earnings forecasts will likely be revised further downward, using $220 as a reasonable expectation for 2023. This brings us to a Price-to-Earnings ratio of 17.45 based on the current value of the S&P 500 Index, which is cheaper than both the 5-year average of 22.12 and the 15-year average of 19.30. If earnings per share remained flat at around $200, it would equate to a P/E ratio of 19.20 based on current value, still below recent historical averages but certainly not cheap.
Robust consumer spending has kept earnings, and thus equity prices, from falling off a cliff. But with the Fed actively trying to trigger layoffs, the consumer may soon reach their limit. Holiday spending has been down, although some of that was demand pulled forward by early Black Friday sales, which were decent.
Investors who maintained international diversification fared marginally better in 2022 as Developed Market international stocks were down -14.4% while Emerging Markets fell -20.6%. International stocks remain cheap relative to their US counterparts heading into 2023 and have benefited from a weakening US dollar, although the geopolitical risks from the Ukraine war and China COVID struggles are major headwinds that are yet to be resolved.
For fixed income investors, 2022 has been as tough of a year as ever. The benefits of stock-bond diversification disappeared and both asset classes declined in unison. The prospect of recession has put some downward pressure on rates despite the Fed hikes, with the 10-year yield settling in the range of 3.5-3.75% in recent months after topping out at 4.25%. While recession chatter is rising, high yield bonds are not yet reflecting major signs of risk. The ICE BofA US High Yield Index Option-Adjusted Spread, a measure of high yield risk relative to Treasury bonds, currently stands at 4.81%, well below the July peak of 5.93% and less than half the peak of 10.87% reached during the COVID-19 pandemic. With defaults benign and lower than usual bonds maturing in the next 12 months, high yield bonds appear on relatively stable footing even if the economy slips into a mild recession.
Closing Remarks
When the Federal Reserve and US government enacted unprecedented stimulus to combat COVID-19, we knew that eventually those measures would need to be unwound. The tightening process was always going to be painful, but few anticipated the war in Ukraine adding fuel to the inflationary fire. While 2022 was a challenging year, there is reason for optimism heading into 2023. The first quarter and possibly the first half of the year are likely to present continuing challenges, but we believe the bulk of the Fed tightening to be over and peak inflation to be behind us. The best years for investing typically follow double-digit declines such as the markets just endured. As investors, we need to remain nimble and vigilant for the sea change on the horizon.