
2023 Mid-Year Update
July 7, 2023
Introduction
The first half of 2023 has been marked by lopsided gains, with a handful of mega-cap tech companies accounting for nearly all of the S&P 500’s 16.9% year-to-date returns, through June 30th. In our 2023 beginning of the year Annual Outlook, we cautioned that despite near-unanimous calls for a first-half recession from major financial institutions, we saw potential for a scenario in which US GDP was able to maintain a slightly positive rate of growth thanks to record low unemployment. Thus far, our prediction of a positive GDP outcome has played out with GDP growth of 2.0% in the first quarter and the Atlanta Fed’s GDPNow model currently forecasting 2.2% growth for the second quarter. We never believed we would have a recession this year as it’s improbable with such low unemployment. While we know better than to celebrate at halftime, for the time being, what was one of the most unanimously predicted recessions has been postponed, possibly indefinitely.
Even if a recession appears before year-end, the economy’s resiliency coupled with equally impressive corporate earnings have investors looking past a potential downturn and towards a prolonged recovery that should accompany a shift in Fed policy from tightening to expansion. This forward-looking optimism has pushed growth stocks in exciting new technologies such as artificial intelligence to lofty valuations, defying the traditional narrative of growth stock underperformance during periods of elevated interest rates.
Despite the stock market’s optimism, there are multiple obstacles that need to be overcome if the economy is to emerge from this rising interest rate cycle in a state supportive of healthy economic growth. First and foremost is inflation. The Fed is seeing some progress, but the gains have been slight and ignoring the noise from volatile categories of food and energy, inflation remains far above the Fed’s 2% target level. The second major threat is banking sector disfunction, which became evident as several banks failed to manage their interest rate duration exposure and subsequently collapsed. The third major risk on the horizon is also tied to the banking sector, that being the vulnerability of commercial office real estate and the overweight exposure to that subsector among mid to small banks as the primary holders of Commercial Mortgage Backed Securities (CMBS). Finally, we see uncertainty surrounding debt, both public and private, as the government and individuals may have overextended their borrowing to unsustainable levels.
Economic Backdrop
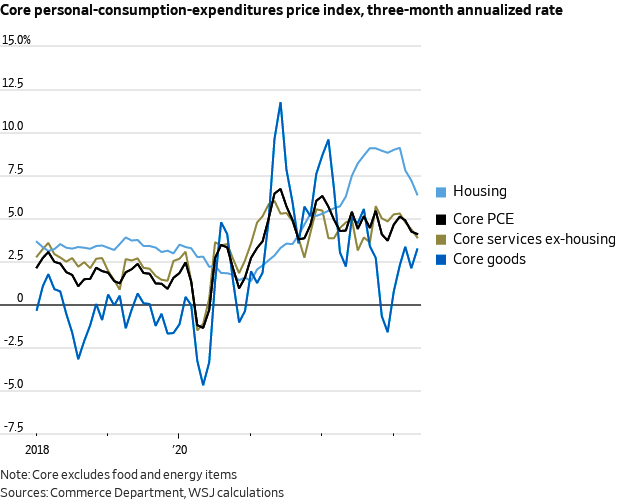
There are several metrics by which economists measure inflation, but in this commentary, we will stick to the Fed’s preferred datapoint, the Core Personal Consumption Expenditure (PCE) index. Core PCE is presently 4.6% year-over-year. Annualizing the last three months of data, as the Fed often does, yields a rate of 4.0%, slightly better but still double the Fed’s 2% target. Housing, which comprises roughly 17% of the calculation, has been a persistent thorn in the Fed’s side but data showing increased vacancies and lower rates for rentals suggests that there could be some relief in the second half of the year. Recent data from vacation rental site Airbnb showed a steep decline in occupancy rates and income in some regions, which may lead to an influx of existing homes for sale as speculators abandon their investment properties, which would help alleviate the supply shortages that have pushed home prices higher.
Producer Price Index (PPI) data, which typically leads consumer data, looks much better. PPI was negative for the month of May and Core PPI (excluding food and energy) was flat, with both measures trending persistently lower since their March 2022 peak.
Exhibit 1. PPI and Core PPI, Year over Year
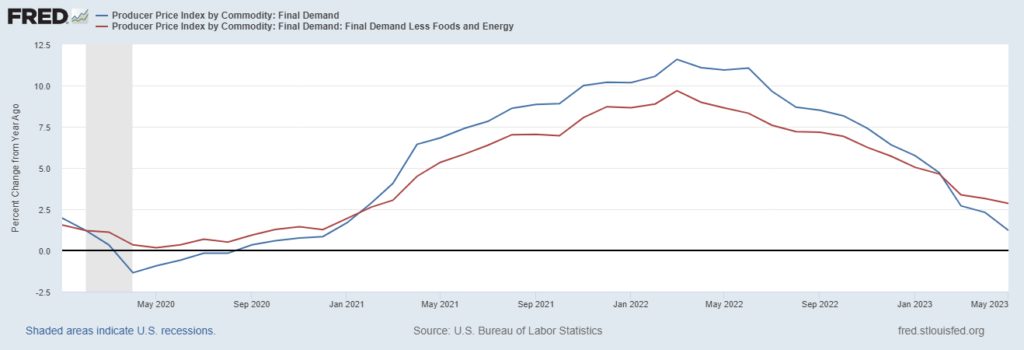
It seems likely that the progress in the underlying housing component and the cooling PPI measures will eventually translate into lower inflation for the Core PCE. The March bank failures gave the Fed reason to pause on rate hikes in June, and the Fed won’t need to take rates much higher if data shows a steeper decline in Core PCE as some of the housing and rental market price pressures recede. May’s Core PCE was an encouraging development on housing inflation, which came in at a still-high 7.8% annualized rate, but the rolling three-month annualized rate has fallen to 6.4%, demonstrating the improvement in recent months.
Exhibit 2. Core PCE and Underlying Components, Three-month Annualized Rate
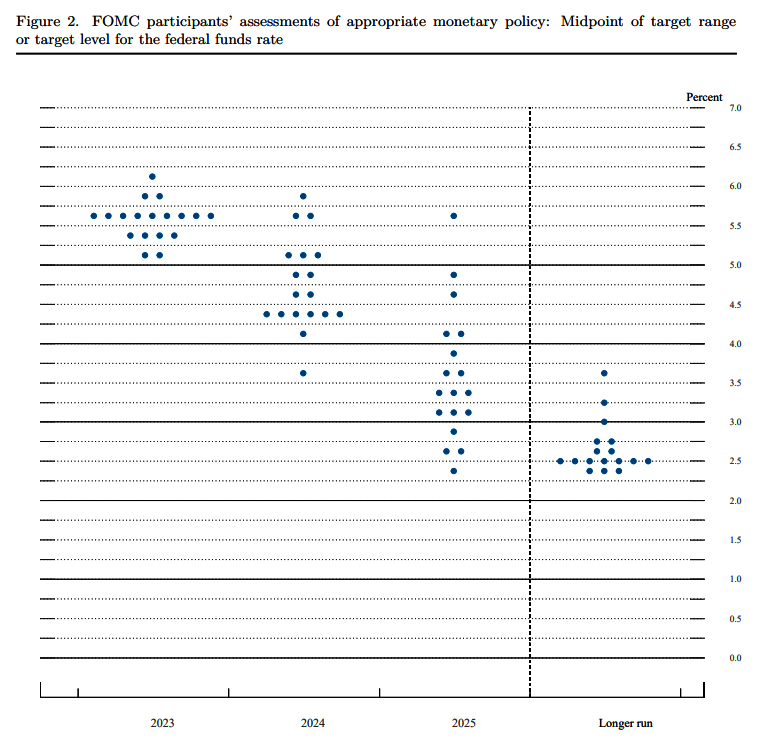
The Fed’s “dot plot” Summary of Economic Projections shows the median Fed Member forecasting 50 basis points of additional hikes before year-end. The collective intelligence of investors, expressed via the Fed Funds Futures probabilities, suggests a single 25 basis point increase before year-end. The market and the Fed have been at odds in their forecasts since the start of this rate cycle, with the market doubting the Fed’s resolve each time the central bank increased its rate forecast. Thus far, the Fed has followed through with its projections and unless we see sudden progress on inflation or another bank panic, there is no reason to doubt they will push forward with 50 basis points.
Whether we get 25 or 50 basis points, the market has essentially moved on and is looking towards the pivot to rate cuts, which it also believes will be sooner and steeper than the Fed’s dot plot suggests. The Fed is projecting rates end 2024 at 4.25-4.5% while Fed Funds market estimates are 25 basis points lower at 4.0%-4.25%. Either way, the implication is that the Fed will shift to easing sometime in 2024, whether due to a recession or victory on the inflationary front.
Exhibit 3. Fed Summary of Economic Projections (“Dot Plot”)
We remain optimistic that the economy can possibly remain in positive GDP territory for the duration of the year, largely due to the resiliency of the jobs market. The unemployment rate remains historically low at just 3.7%, and while it is possible that we get a “full-employment recession”, it would be an unprecedented anomaly. Getting to a positive GDP, falling inflation, low unemployment soft landing will depend on the economy’s ability to withstand the Fed holding rates at present levels or higher, with the biggest risk being the exposed vulnerabilities of the mid to small, also known as regional, banking sector.
As we saw during the March bank failures, duration mismatches stemming from the Fed rate hikes have introduced a major element of risk for banks. Regional banks are also facing a major challenge as the primary holders of commercial mortgage debt (commercial mortgage-backed securities, aka CMBS), with office space looking extremely vulnerable to major repricing risk as vacancy rates reach all-time highs amidst the shift to remote working and shopping. The result for the banks will be higher loss reserves, less willingness to offer new loans, and the Fed may need to step in to buy CMBS assets before the situation is resolved.
The silver lining to tighter credit standards from banks looking to shore up their balance sheets is that those measures may alleviate some of the inflationary pressures that the Fed has been unable to address with interest rate hikes. Therein lies the path to the elusive “soft landing” that seemed like an impossibility last year as data point after data point showed rampant inflation. If we are to believe Chairman Powell that the banking sector is “sound and resilient”, then the regional bank panic may have scared the banks just enough into discouraging lending behaviors that are inflationary. Stricter lending standards may be the ingredient which has been missing from the Fed’s deflationary elixir, which up to now has consisted solely of rate hikes.
US Equity
In our beginning of the year outlook, we noted that investor cash was at its highest level since the September 11th terrorist attacks. We suggested capitalizing on the opportunity to scale into the market and not wait for a Fed “pause” or “pivot” moment, because the market reversal would likely occur on leading inflation indicators and not due to an actual Fed policy announcement. Notably, investors continue to be cautious on equities in 2023, with US stock funds posting $37 billion in outflows while money market funds have attracted $404 billion in inflows.
Despite this apparent bearish investor sentiment, the S&P 500 rallied to a 16.9% first half performance and the Nasdaq has surged 31.7%. At the halfway point, the S&P 500 has risen from 3,824 to 4,450, already exceeding the Wall Street strategist’s average price target of 4,080 for year-end based on the aggregate of the 23 prominent forecasters listed below:
Exhibit 4. Notable Wall Street 2023 S&P 500 Price Targets
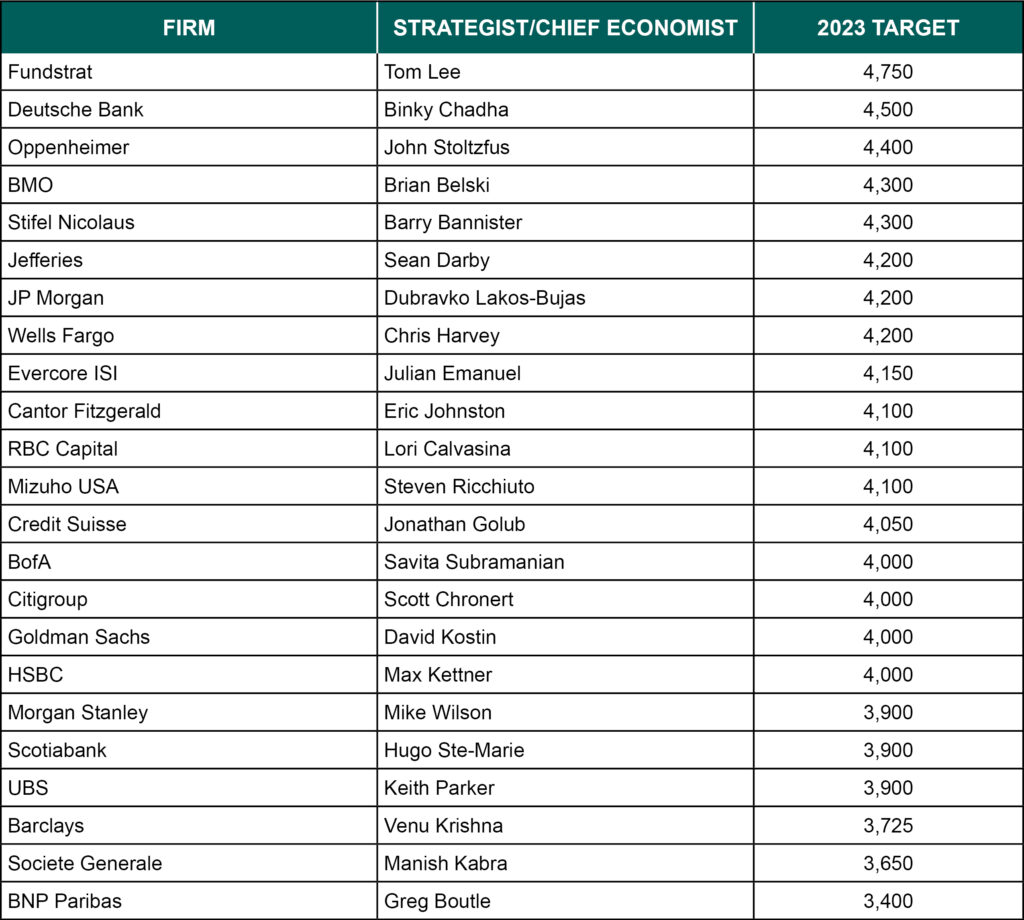
Of course, these are year-end forecasts, so we need to see how the second half plays out, but it does appear that most analysts underestimated the resiliency of the corporate earnings. In the first quarter,
S&P 500 companies posted their best rate of upside earnings surprises since Q1 of 2022, at 76.6%. The spike in demand for all manner of goods and services following the lifting of pandemic restrictions has not faded as many economists predicted, and businesses have taken notice and maintained the price hikes initially attributed to supply chain disruptions. It seems unlikely that US consumers can maintain such ravenous spending, and some anecdotal evidence such as the roughly $1 trillion in credit card debt outstanding suggests consumption may taper off shortly. The resumption of student loan interest payments in October will also likely have a big impact on consumption as will the Supreme Court’s ruling against President Biden’s proposed student loan forgiveness. The average monthly student loan payment is just under $400, and there are 43 million borrowers with student loans. As a result, there should be a measurable decline in discretionary spending, which would be deflationary since corporations may be forced to lower profit margins to maintain market share .
The counterargument is that corporate profits may not matter that much if you look at where the gains in the market have been concentrated. The US stock market breadth has been weak, which is another way of saying only a handful of companies have been driving all the market gains. Mega-cap technology companies – Apple (AAPL), Microsoft (MSFT), Nvidia (NVDA), Alphabet (GOOG), and Amazon (AMZN) have accounted for the lion’s share of the gains in the S&P 500 this year. Outside of these companies, other tech has also been strong, with the SPDR Technology ETF (XLK) up over 40.3% year to date. Investors are focused on the next wave of innovation, plowing money into stocks poised to lead the way in artificial intelligence, autonomous vehicles, and other cutting-edge pursuits.
For the rally to persist, we want to see a broadening out of the market gains to other sectors. Among the neglected market sectors are Energy, down -5.4% year to date, and Financials, down -0.5%. Energy and Financials are the cheapest two sectors, trading at 9.9x and 12.6x 2024 forecasted operating earnings, respectively. Energy sector stocks have been challenged by the prospect of a global recession, along with persistent shorting of oil prices, which has drawn the ire of Saudia Arabia. It is likely that OPEC will continue cutting production to battle the shorts, which could put upward pressure on oil prices in the near term. Energy also faces the never-ending headwind of global environmental issues.
Financial sector stocks are likely to remain weaker until the Fed begins cutting rates, which seems counterintuitive. Typically, shares of Financials typically perform very well during periods of elevated interest rates, as net interest margins (the spread between interest received and interest paid by banks) increase. This rate hike cycle has played out differently, however, as the rapid pace of the Fed rate hikes caught some banks off guard and their long-maturity investments are not generating sufficient yield to meet depositor rate demands. Banks are suddenly competing with Treasuries paying 5% or more and have replaced some of the traditional deposits that customers pulled from their balance sheets with brokered deposits, Federal Home Loan Bank borrowing, or even the Fed Discount window. These higher cost sources are eating into net interest margins and have reduced profitability for the sector.
Major banks have passed stress test scenarios consisting of a hypothetical 40% collapse in CMBS valuations, but regional banks are not subject to the same tests and hold most of the exposure. Financials look like a high-risk play given the challenging environment, but the Fed has repeatedly demonstrated a willingness to rescue the sector, so there could be a major upside play if bank panic returns and the Fed once again provides a bailout.
Developed International Equity
Developed International, aka Developed Market (DM), stocks outperformed their US peers until the June US tech rally. Year to date, DM stocks are up 12.5%. The fact that DM stocks haven’t lagged more significantly is surprising considering Technology is just 8% of the MSCI EAFE Index, the most widely followed DM index. Within DM countries, Japanese stocks have been strong performers this year, up 14.5% thanks largely to a surge in capital investment and stock buybacks. Japan is also benefiting from corporate reshoring, as companies seek to move supply chains away from an increasingly unpredictable China, particularly in high end industries such as semiconductor manufacturing.
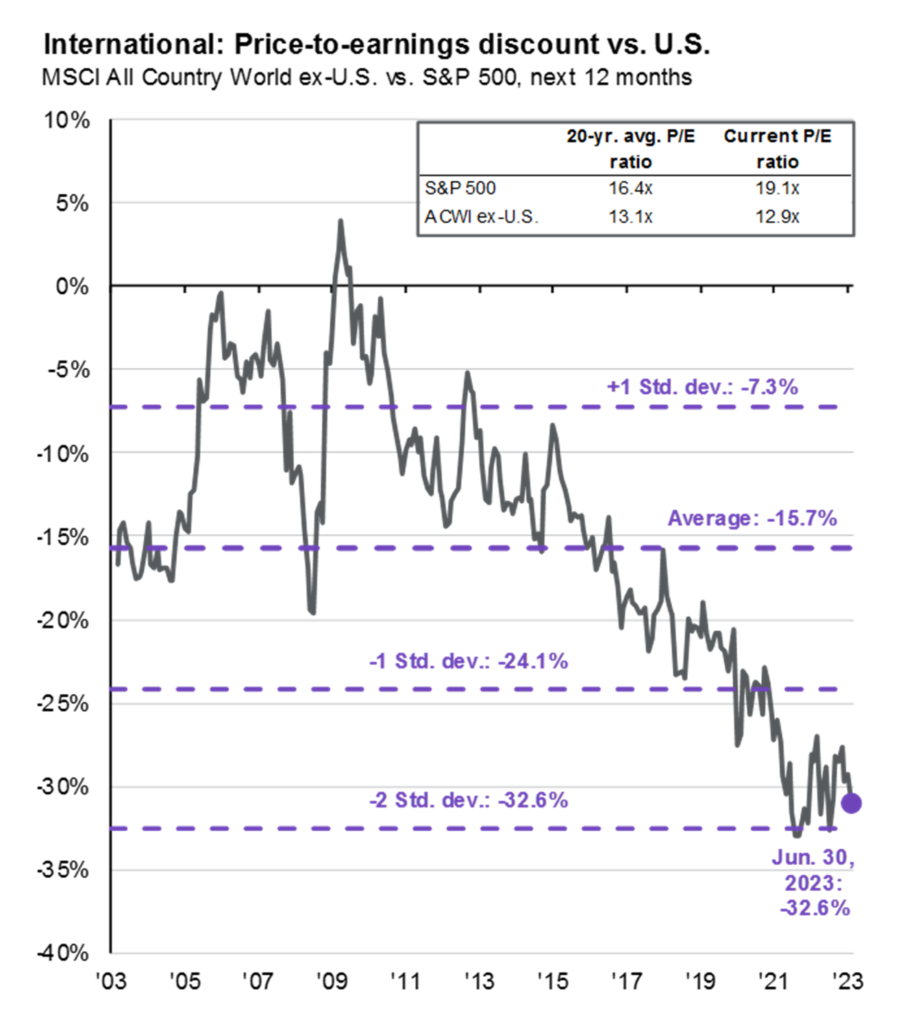
Like the Fed, the European Central Bank (ECB) is also locked in a battle against inflation, with Core inflation currently at 5.3%. The ECB and Bank of England have signaled that more rate hikes are coming, a tough pill to swallow with the Eurozone economy on a weaker footing than the US. The first quarter marked a technical recession for the Eurozone with GDP shrinking by -0.1%. With this less favorable economic backdrop, Eurozone stocks may struggle to keep pace with their US counterparts. The case for long-term asset allocation to DM remains, however, for diversification benefits and because DM stocks in general remain far cheaper from a valuation perspective than US stocks.
Exhibit 5. P/E Discount of Foreign vs US Stocks
The ongoing war in Ukraine has also been a persistent threat to European stocks for over a year now given their proximity to the conflict, but stocks will undoubtedly bounce back sharply if the war ends. With Putin’s dictatorship seemingly weakened, and the resolve of the Ukrainian leadership and people undeterred, the path to peace seems more likely than it was at the start of the year.
Emerging Market Equity
Emerging Market (EM) stocks have lagged thus far in 2023, as estimates for Chinese GDP growth have fallen to 5.2%, according to Standard & Poors. There was widespread optimism that economic reopening measures in China could lead to outperformance this year, but a staggeringly high youth unemployment rate of 20.8% and shrinking corporate margins and manufacturing output in China have cast doubts on those prospects. The Chinese central bank cut lending rates and is attempting to paint an optimistic picture, but the official government data remains suspect. For example, China’s official calculations count anyone working one hour per week as “employed” so the true unemployment rate could be much higher than officially reported. Investing in any Chinese company remains extremely high risk, due to both the lack of transparency and the Communist Party of China’s tendency to forcibly exert its influence on corporations whose plans do not align with government’s master plan. China has a 33% weighting in the MSCI Emerging Market Index.
With growth in most EM countries slowing, investing in EM may not pay off for many years, making it a long-term trade best suited for investors with a fairly high risk tolerance. The bull case for EM equities remains mostly a play on demographic trends and the prospects for an expansion of the middle class, not only in China but in other EM nations such as India and Mexico. EM remains a pure numbers game, as the home to approximately 85% of the world’s population and nearly 90% of the global population under 30 years of age.
Fixed Income
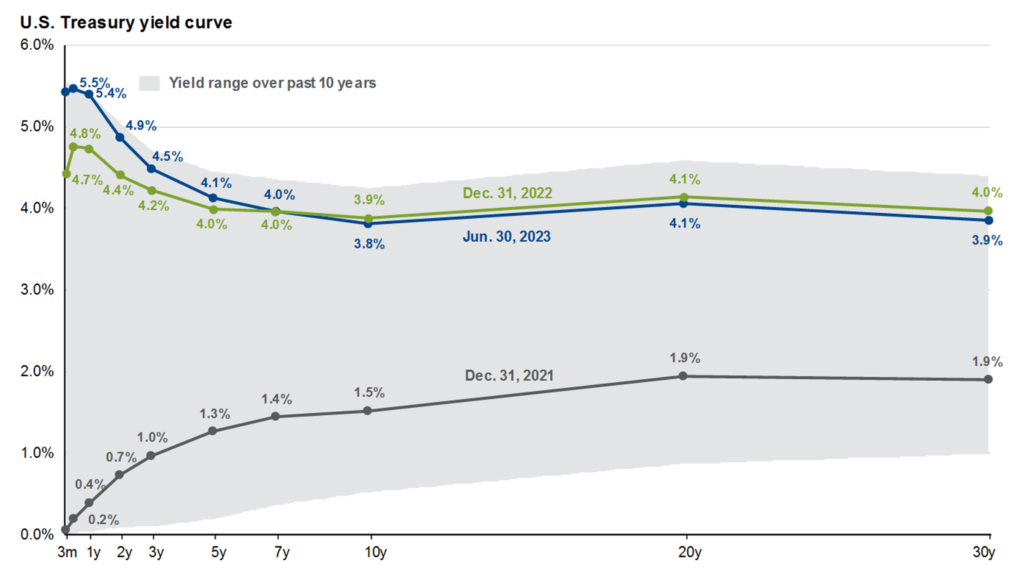
Bonds have been a sanctuary for investors in 2023, with the yield on the benchmark 10-year Treasury note holding steady at 3.75% since late May. Our preference has been to favor the short end of the yield curve, which we believe provides more flexibility for tactical trading strategies and has also provided superior yields currently near 5.5%. Fixed income investors betting on Fed rate cuts in 2023 may be disappointed if the Fed adheres to its mantra of “higher for longer”, therefore we still favor short-duration bonds in the second half of 2023.
Exhibit 6. Yield Curve Comparison 2021-2023
Outside of government bonds, we believe investors who have a relatively higher tolerance for risk can earn additional yield by allocating to high yield bonds. We grew cautious on the asset class at the onset of the March bank failures, but with the Fed once again willing to extend a lifeline to regional banks, we believe that high yield borrowers will still be able to access credit needed to issue new debt as needed. High yield bond trailing twelve-month default rates, at just 2.18% as of May 31st, remains below the long-run average of 3.55% and recovery rates on defaults are only marginally below the 40% long-term average at 37%. With yields over 8% and no immediate indications of an uptick in defaults, high yield remains prominent in our asset allocation recommendations for the second half of the year.
The black sheep of the fixed income market, for the time being, is commercial mortgage-backed securities (CMBS), which have garnered negative press due to soaring vacancy rates at office buildings and retail space. Overall, only 0.24% of outstanding CMBS loans are 30 days delinquent, far below the all-time high of 10.34% in July 2012. But office space is clearly a weakness, with delinquencies eclipsing 4% for the first time since 2018 while retail delinquencies are currently at 6.7%. As we mentioned in our discussion of Financial sector stocks, there could be a second half high-risk contrarian opportunity in the CMBS sector if panic sets in, as the Fed could potentially come to the rescue once again and take the securities onto their balance sheet.
Commodities and Alternatives
Oil prices fell in the second quarter and remain rangebound around $70 but we believe the most likely move is to the upside as aggressive shorting of crude seems to be overestimating the likelihood of a major US or global recession. Global demand is still projected to rise to an all-time high of 102.3 million barrels per day, so we should be on track for shortages during the summer months. Meanwhile, Saudi Arabian energy officials have grown irate at persistent hedge fund shorting in the futures markets, elevating the likelihood of a surprise production cut. Master Limited Partnerships, aka MLPs, those investments that for example are typically involved in storage and distribution pipelines for oil and natural gas, surged roughly a year ago but have stayed in a trading range since then, although dividend yields have been solid at nearly 8%. While we favor bonds for income generation in the current environment because they should outperform in a recessionary scenario, MLPs are a good diversifier for yield-focused investors.
Our outlook on Real Estate Investment Trusts (REITs) remains consistent, with some sub-sectors likely to outperform and others facing significant challenges. The weakest REITs are, predictably, office space and retail stores. We see pockets of strength in healthcare and data centers. Residential REITs providing multifamily housing could be a beneficiary of continuing Fed rate hikes, as higher interest rates are an impediment to homeownership and boost demand for rentals. Overall, REITs are highly rate sensitive, however, so scaling in ahead of a Fed rate pause could be the best approach to the sector.
Final Thoughts
When we began the year, we cautioned that “the most widely forecasted recession in history” may never arrive. First quarter GDP growth of 2.0% is a testament to the resiliency of Americans as both workers and consumers. With most major Wall Street price targets for the S&P 500 already exceeded, one would expect a cooling off period as investors wait to see if the Fed finally demonstrates progress in reducing inflation. We believe the data is, very slowly, trending in the right direction and the market has grown accustomed to Fed rate hikes without the volatile reactions we saw at the beginning of the cycle over a year ago. With this in mind, we believe the risk of missing a potential upside reaction to a Fed pause on good inflation data outweighs the risk of a negative reaction to the telegraphed 50 basis points of additional hikes. Investors who kept a forward-looking mindset and looked at the leading indicators during the first half of 2023 were rewarded, and we believe this approach will continue to work in the second half. A final point is that inflation can drive costs of goods higher, which drives top line revenues for companies higher, which can lead to higher earnings, which can lead to higher stock prices. That is one view of the current US stock market. So, in this inflationary environment, stocks still look wise.
Vestbridge Advisors, Inc. (“VB”) Is registered with the US Securities and Exchange Commission as a registered investment advisor with principal offices at 3393 Bargaintown Road, Egg Harbor Township, NJ. The information contained in this publication is meant for informational purposes only and does not constitute a direct offer to any individual or entity for the sale of securities or advisory services. Advisory advice is provided to individuals and entities in those states in which VB is authorized to do business. For more detailed information on VB, please visit our website at www.Vestbridge.com and view our Privacy Policy and our ADV2 Disclosure Document that contains relevant information about VB. Although VB is a fairly new organization, any references herein to the experience of the firm and its staff relates to prior experience with affiliated and nonaffiliated entities in similar investment related activities. All statistical information contained herein was believed to be the most current available at the time of the publishing of this publication.