2024 Mid-Year Update

July 5, 2024
INTRODUCTION
When we penned our Annual Outlook, we noted that markets were beginning to return to a semblance of “normalcy” as the effects of pandemic-era rate cuts and subsequent hikes from the Federal Reserve (the “Fed”) were poised to unwind. The shifting focus from inflation data and Fed policy decisions back to bottom-up fundamentals and corporate earnings was a welcome change for investors, who have grown weary of scouring monthly inflation releases and Fed meeting minutes for clues on when the central bank will unwind its historic rate hikes.
Half-way through 2024, it does appear that things are getting back to normal, albeit slowly. The Fed is still leaning hawkish on rates, not yet tipping its hand on the timing of a 2024 rate cut or even confirming that one will occur. Yet, markets have largely shrugged off any disappointment over the fact that rate cut expectations (gleaned from Fed Fund Futures markets) have cratered from six rate cuts at the onset of the year to just one or two presently expected. In prior years, such a hawkish revision would have sent equity markets plummeting, yet halfway through the year we have already blown past the year-end predictions that the major banks made under the assumption of up to six rate cuts.
Exhibit 1. Wall Street Banks’ 2024 S&P 500 Targets (prior to any revisions, as of year-end 2023)
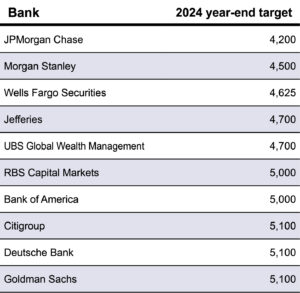
The fact that markets are now trading at all time highs is due to the culmination of several factors – strong corporate earnings, excitement over Artificial Intelligence (AI) breakthroughs, persistently low unemployment, US dominance in GDP, and perhaps a bit of “Fed fatigue” from investors. Of course, we know markets don’t just go up, and there are risks in the second half that could derail the impressive market performance; namely, the US election, war in Ukraine and Gaza, unsustainable US debt, and the possibility that inflation reverses higher.
While keeping aware of these risks, we see the path for the market to take another leg higher in the second half, if performance can broaden beyond the mega-cap tech stocks that have been responsible for much of the year-to-date gains. The Fed has been given the gift of time thanks to corporate earnings and consumer spending that have kept markets and the economy afloat. Now, we just need inflation to ease a bit further to spur the first rate cut and perhaps we will get to enjoy the long-awaited soft landing.
ECONOMIC BACKDROP
Heading into 2024, inflation was trending lower at a rate that had Fed Funds Futures markets pricing in an 80% likelihood of a March rate cut. The Fed’s preferred inflation metric, the Core Personal Consumption Expenditures (PCE) index, had clocked in at just 0.1% in July, August, October, and November of 2023. The three-month annualized rate of inflation was trending right around the Fed’s 2% target at the time, so it was reasonable to expect that as older, high inflation data points fell off the annual calculations, the trailing twelve-month rate would fall dramatically as well.
Yet, we felt a March rate cut was a bit aggressive as it required some downside surprises in the January and February inflation reports. January was a big step backwards, with Core PCE spiking to 0.5% in the month. Any hopes that it was just a seasonal holiday spending-induced anomaly were cast aside when February followed up with 0.3% Core PCE. Suddenly, the three-month annualized rate shot up to 4.0% and any hopes of a first-half rate cut quickly faded.
The Fed, being “data dependent”, has significantly revised its Summary of Economic Projections “Dot Plot” several times, showing three rate cuts in March and presently only a single rate cut as of its June revision.
Exhibit 2. June 2024 Fed “Dot Plot” Highlighting March and June Median Forecasts
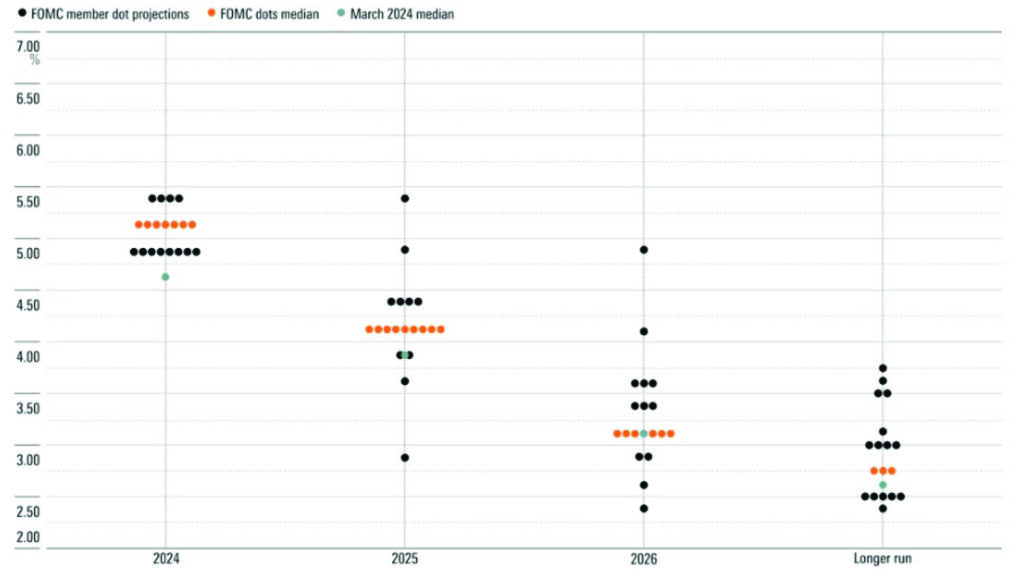
Statements from Fed speakers indicate they still view the risk of reigniting inflation as a greater evil than strangling economic growth with prolonged rate hikes. In truth, the rate hikes haven’t done much to reign in economic growth, which clocked in at 1.4% in the first quarter and will likely rise to above-2% in the second quarter. The undeniable fact is that US consumers are still spending freely, perhaps cutting back slightly on goods but still opening their wallets for services. Elevated interest rates have also failed to deter companies from hiring and retaining workers, which has kept the unemployment rate at 4% or lower since January 2022.
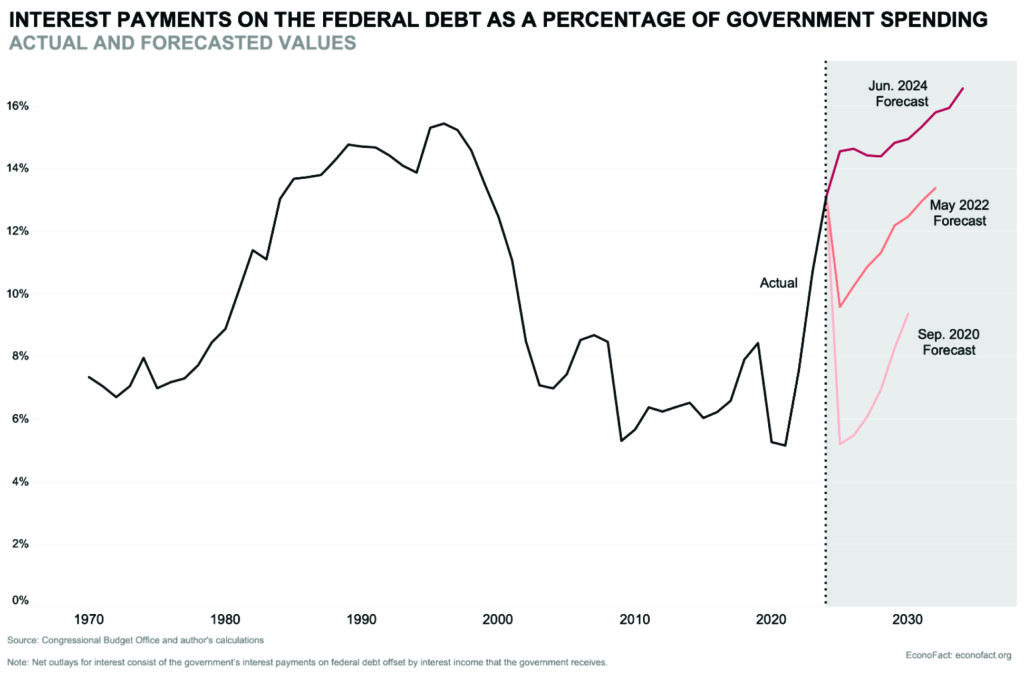
Perhaps the factor that will finally force the Fed’s hand will be government debt, an issue that is sure to dominate headlines in the coming months as we approach the Presidential election. The Fed’s rate hikes have increased the cost of interest on federal government debt to a projected $892 billion for 2024. Interest on the federal debt burden this year will likely exceed total defense spending. Clearly, something needs to be done beyond the semi-annual debt ceiling theatrics. The longer the Fed keeps rates elevated, the louder the calls from Congress will grow to lower rates and reduce federal borrowing costs.
Exhibit 3. Interest Payments as Percent of Government Spending
Looking ahead, softening shelter costs are the most important factor towards maintaining recent progress on overall inflation. Shelter has been a persistent challenge as the Fed’s rate cuts and subsequent hikes created something of a Catch-22 where 60% of existing homeowners locked in mortgage rates below 4% and are disincentivized to sell their homes and lose the rate. This limits the supply of homes on the market, increasing prices and negating the downward pricing pressure that the Fed is trying to engineer via higher rates. Consumer Price Index (CPI) shelter inflation has risen for four consecutive months and is presently at 5.4% annually. The Fed doesn’t seem to have a good solution, other than pointing out that data on shelter costs lags other inflation components due to its reliance on surveys and the stickiness of rental costs (since leases are contracted on an annual basis). Hopefully, the Fed is correct and future shelter price data eases.
US EQUITY
Year-to-date, it has been a continuation and even acceleration of the mega-cap dominance of the “Magnificent Seven” (“Mag 7”) stocks – Nvidia (NVDA), Meta (META), Tesla (TSLA), Amazon (AMZN), Alphabet (GOOG), Microsoft (MSFT), and Apple (APPL). Aside from Tesla, these names have kept up the momentum in the first half of 2024, joined by other mega-caps such as Eli Lilly (LLY) and Broadcom (AVGO).
As we noted in our recent commentary, the market-cap percentage of the top 10 largest S&P 500 stocks has risen to the largest on record, at over 35% of the index. The top-heavy nature of the index exposes markets to higher-than-normal stock-specific risk, but also represents an opportunity for the broader market to make up ground. For that to happen, investors need reason to shift allocations from the Mag 7 names to the index laggards.
So far, that has been a hard case to make. The common denominator among the best-performing mega-caps is exposure to AI. Unlike the speculative dot-com bubble of unprofitable start-ups, the leaders of the AI surge are huge, established, profitable corporations with massive amounts of cash at their disposal to invest in research and development. Their AI investment is already paying off in high-growth business segments like cloud computing. The case for AI has already been made in the earnings calls, where lofty expectations have repeatedly been blown away by Nvidia and other companies with AI exposure.
Yet, the second wave of AI is going to involve the customers of these firms integrating the technology into their businesses and finding innovative solutions to improve efficiency. AI should potentially touch nearly every industry in some way – use cases have already emerged for inventory management, call center operation, pharmaceutical research, and a multitude of other business applications. The use cases for AI extend far beyond the headline-grabbing examples such as self-driving cars and robotics.
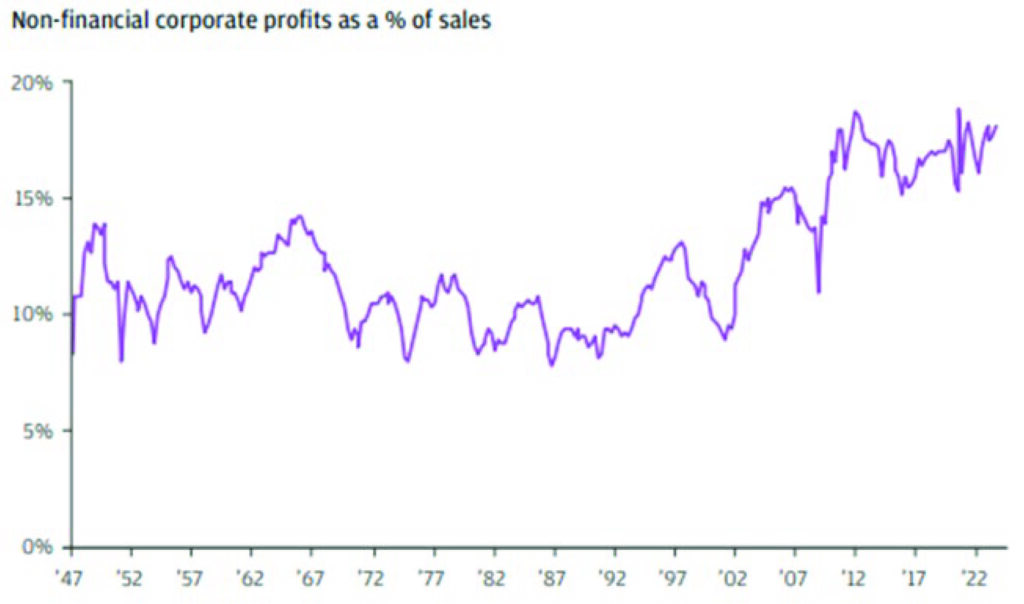
Aside from the AI boom, it has been a solid year for corporate earnings across all sectors. Real Estate is the only S&P 500 sector in the red year-to-date, and there have been some surprising outperformers like Utilities stocks. Despite complaints over price-gouging, free-spending consumers haven’t cut back meaningfully, which has allowed corporations to reach profit margins of nearly 18%.
Exhibit 4. Non-Financial Corporate Profit Margins
While there are some concerns about valuations and overbought markets, we believe that economic growth amidst a falling interest rate environment will allow S&P 500 companies to continue to grow earnings, and possibly exceed analyst expectations for 11.3% earnings growth in 2024 and 14.4% in 2025 (estimates as of June 21, per FactSet). We also maintain that investors should continue to accumulate positions in small and mid-cap stocks in advance of the first Fed rate cut. As we saw when the Fed pivoted from hikes to a pause in November, small and mid-caps can quickly make up lost ground when borrowing conditions soften.
DEVELOPED INTERNATIONAL EQUITY
Foreign developed market (DM) stocks have underperformed their US peers over eight of the last ten years, continuing a trend that has been ongoing since the global financial crisis. Consider that in 2008, US stocks represented less than 40% of the world’s stock market capitalization. Today, US stocks encompass 61% of global market cap, yet the US accounts for roughly a quarter of global GDP. The persistent underperformance of DM stocks led to diminished market cap share and kept the MSCI EAFE Index trading at a forward price-to-earnings (P/E) multiple of just 14x, making DM stocks look relatively cheap compared to their domestic peers.
Yet, year after year, bargain hunters have not been rewarded for diversifying into international stocks. Midway through 2024, DM stocks are once again lagging, but conditions are arguably moving towards a more favorable setup for the second half of the year. The main catalyst for potential DM outperformance in the near term is the fact that DM central banks are ahead of the Fed in their inflation battle, and in some cases have already begun the rate cut cycle.
The European Central Bank (ECB) has already cut rates and some countries such as Switzerland have already implemented multiple cuts. During 9 of the prior 11 rate cut cycles, European equity markets were up twelve months later, and by an average of 20%. Considering that Eurozone GDP is expected to rise 0.7% this year and accelerate to 1.4% in 2025, DM equities could get a shot in the arm from the ECB’s head start in cutting rates.
The biggest single country in DM indices, Japan, lies outside the Eurozone and was the star performer in 2023, outperforming the S&P 500. Japanese equities have cooled off in the second quarter as the Yen fell to a 38-year low. While the weaker Yen was initially considered to be a positive for Japanese exporters such as Toyota (TM), the currency has fallen so rapidly that it is beginning to raise concerns over higher prices for food and energy imports impacting economic growth. There have been calls for the Bank of Japan to intervene, but it seems the central bank will attempt to hold off in hopes the first US rate cut helps resolve the forex imbalance. Currency issues aside, the Japanese economy has the benefit of lower interest rates and lower inflation in addition to favorable investor reforms implemented by regulators.
EMERGING MARKET EQUITY
In prior outlooks, we have noted that investing in Emerging Markets (EM) involves elevated uncertainty and risk due to the unpredictable nature of the Chinese government. Investors have been burned numerous times over the past several decades as China repeatedly promised more open and transparent markets before ultimately intervening to the detriment of global investors.
The demographic and economic challenges facing China, which we laid out in our 2024 Outlook, have yet to be resolved. The Chinese government has implemented a $42 billion lending facility to acquire unsold properties and convert them to government housing, but that amount will not move the needle on the glut of unsold property. A Goldmans Sachs study estimated that to bring the inventory of vacant homes down to 2018 levels, the government would have to spend over $1 trillion dollars to buy up the unsold homes – at a 50% discount! That doesn’t include the inventory of pre-sold, unfinished buildings that would need over $550 billion to reach completion. Chinese builders have defaulted on roughly $125 billion in debt in the tangled web of China’s “shadow banking” system.
The other major red flag for Chinese stock investors is the increasingly contentious relationship with the US over access to critical technology, and the increasingly punitive tariffs being imposed by US lawmakers. President Biden initially sought to smooth over the US-China relationship after the Trump administration’s tit-for-tat trade war. Yet due to the sensitive security implications involved in cutting edge semiconductors, the US has become much more stringent in regulating business with China. If Trump is re-elected, the hostile rhetoric is bound to increase, which adds a great deal of uncertainty until the November election is over.
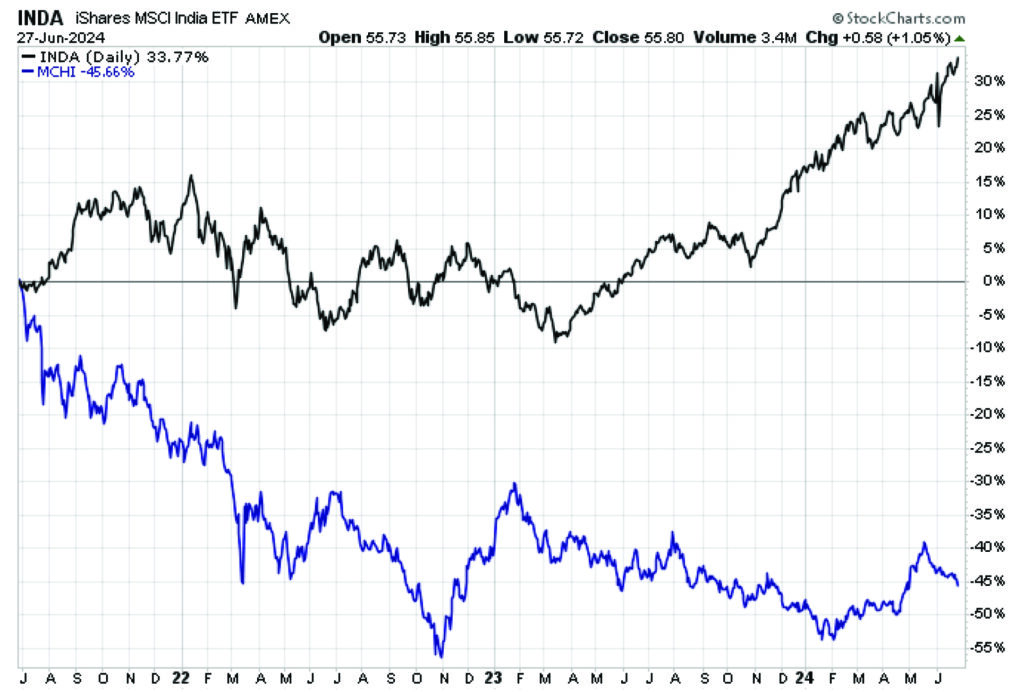
While China seems like a tough sell for investors, other EM countries have benefited greatly from its struggles. India has found favor from investors and corporations looking for a potential heir to the EM throne. Indian stocks have nearly kept pace with the S&P 500 over the past three years and have outperformed Chinese stocks by a cumulative 77%.
Exhibit 5. Three-Year Performance of India (INDA) vs China (MCHI)
EM stocks have a place in diversified, long-term portfolios, but investors need to be aware of the unique challenges involved in investing in an asset class dominated by a Communist regime with its own agenda and tendency to meddle in corporate affairs.
FIXED INCOME
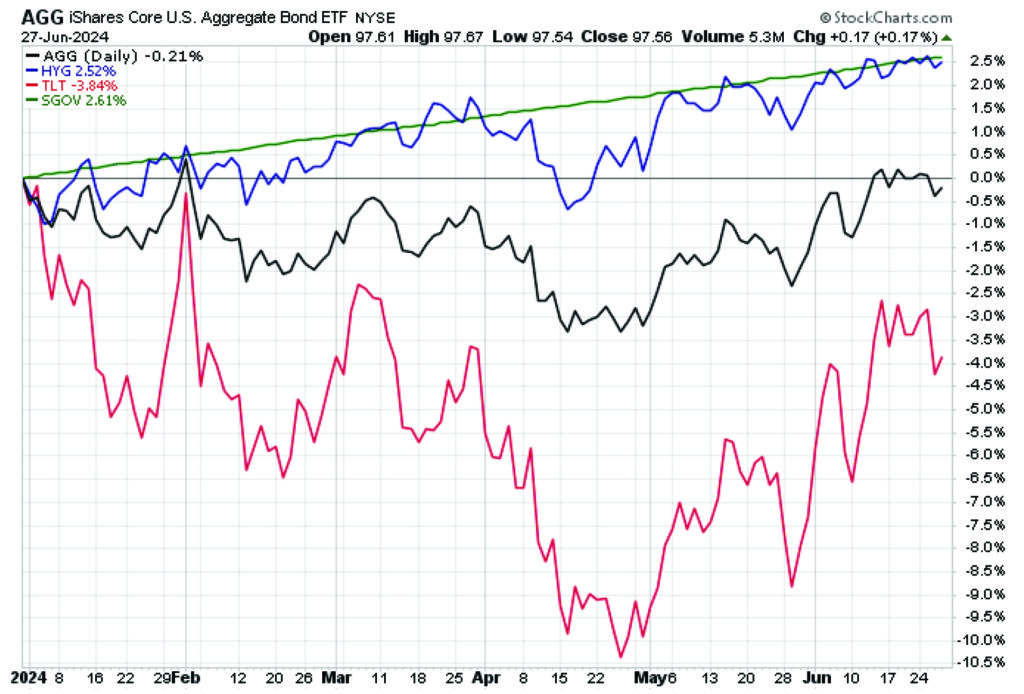
For fixed income investors, the Fed’s delayed rate-cut timeline has turned 2024 into a waiting game. Active fixed income investors have attempted to get the jump on rate cuts by buying into the long-end of the yield curve, which has helped long-term Treasuries partially recover from the -10% decline that bottomed out in late April (using the iShares 20-Year+ Bond ETF, ticker TLT). Barring a backslide in inflation data, rates have likely peaked for the cycle at prior highs of 5% for the 10-Year Treasury, so eventually long-duration bonds should have a moment of large outperformance. The challenge is timing that moment or having the patience to endure drawdowns like the initial 2024 pullback.
There is a less-than-zero probability, at this time, on the table that the Fed does not cut rates at all in 2024. This potential outcome has kept a lid on the upside for long-term bond investors. Meanwhile, the short end of the yield curve continues to offer the most attractive rates. Pairing risk-free yields of around 5.35% from short-term Treasury bills with corporate high yield bonds has been a winning strategy thus far in 2024. Both these asset classes are handily outperforming the Aggregate Bond Index and Long-Term Treasuries.
Exhibit 6. Fixed Income Year-to-date Returns – Aggregate Bond (AGG), High Yield (HYG), Long-Term Treasuries (TLT), Short-Term Treasuries (SGOV)
COMMODITIES AND ALTERNATIVES
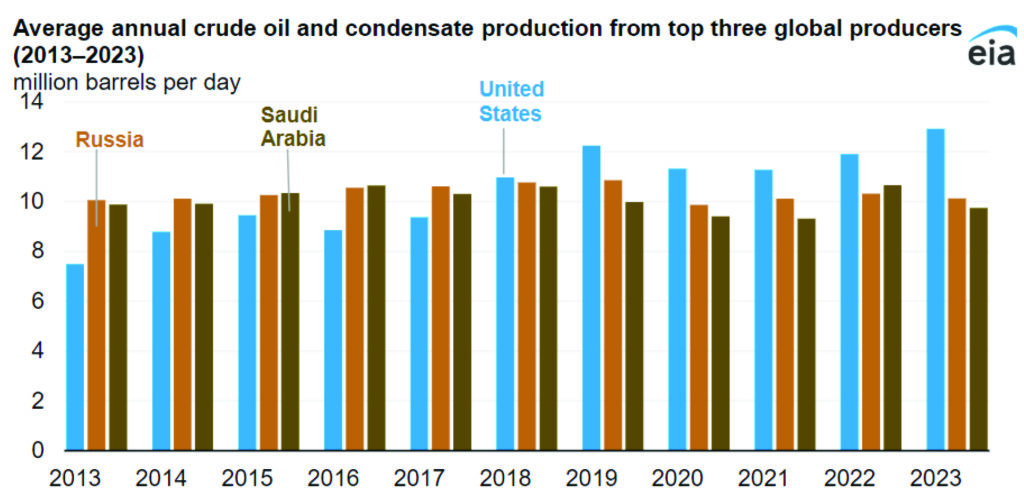
Energy stocks led the way at the start of 2024 on a wave of mergers and acquisitions that looks poised to continue in the second half of the year, especially if Republicans retake the presidency. There has been a fascinating battle between OPEC and the US over oil prices, as the former has aggressively cut production while the latter has more than made up for the output deficit. In 2023, the US produced more oil than any nation in history, averaging 12.9 million barrels per day. So far in 2024, US drillers have averaged 13.2 million barrels per day, a staggering total under a Democratic regime characterized as anti-fracking.
Exhibit 7. Barrels of Oil Produced Per Day – US, Russia, Saudi Arabia
The competing forces of OPEC cuts and US drilling have kept oil prices relatively rangebound in the $70-80 a barrel range for US West Texas Intermediate. US oil independence has helped negate the usual volatility from geopolitical events, and oil prices have been remarkably stable considering that there are two wars ongoing in major oil-producing regions. With global growth looking solid in the coming year, oil demand should remain robust.
Real Estate has been an underperformer for some time, due to the challenges facing the commercial property sector in an increasingly online world. REITs remain relatively unattractive while risk-free government yields are hovering at 5% or more, yet there are some opportunities. Vacancy rates on class B and C (i.e., non-luxury) multifamily rental properties have remained low at 4.6%, as prohibitively expensive mortgage rates have forced more people to rent rather than buy a home. Other REIT sectors, such as datacenters, should see continued demand as AI continues to grow.
FINAL THOUGHTS
The Fed put the champagne back on ice in the first half of the year, yet there is reason for optimism that the long-delayed initial rate cut will still materialize later in 2024. Markets have been impressively resilient and while we want to see an expansion of breadth to include smaller companies and value-oriented large caps, equity investors should be encouraged by the potential revolutionary advances that AI could bring forth. Markets may pull back and take a breather from current levels, yet we think that barring any major inflation letdown, conditions are in place for further market appreciation.
Read the Forbes article – Here
Vestbridge Advisors, Inc. (“VB”) Is registered with the US Securities and Exchange Commission as a registered investment advisor with principal offices at 3393 Bargaintown Road, Egg Harbor Township, NJ. The information contained in this publication is meant for informational purposes only and does not constitute a direct offer to any individual or entity for the sale of securities or advisory services. Advisory advice is provided to individuals and entities in those states in which VB is authorized to do business. For more detailed information on VB, please visit our website at www.Vestbridge.com and view our Privacy Policy and our ADV2 Disclosure Document that contains relevant information about VB. Although VB is a fairly new organization, any references herein to the experience of the firm and its staff relates to prior experience with affiliated and nonaffiliated entities in similar investment related activities. All statistical information contained herein was believed to be the most current available at the time of the publishing of this publication.
