
2023 4th Quarter Review
January 5, 2024
Economic Commentary
The fourth quarter showed encouraging evidence that the Fed may pull off a soft economic landing, with economic data showing persistent improvement in inflation while employment and GDP data continued to surprise to the upside. The fact that consumer confidence and spending has been persistently strong, yet inflation data has been steadily declining suggests that the Fed will be able to ease in 2024 not because of recession, but because inflation is falling in line with the Fed’s 2% target.
Fed officials have been very vocal in their messaging that it is too early to declare “mission accomplished” on inflation. Yet the most recent Fed interest rate “Dot Plot” demonstrated the Fed’s reluctant admission that rates are going to come down in 2024. To their credit, markets called the Fed’s bluff by forecasting early 2024 rate cuts despite the Fed’s insistence that rates would remain “higher for longer” through the end of 2024. Now the Fed has “pivoted” its expectation towards cutting rates by 75 basis points in 2024, while the market is pricing in roughly double that, anticipating rates below 4% by year-end 2024.
Exhibit 1. Fed Median Interest Rate Projections from Policy Meeting “Dot Plots”
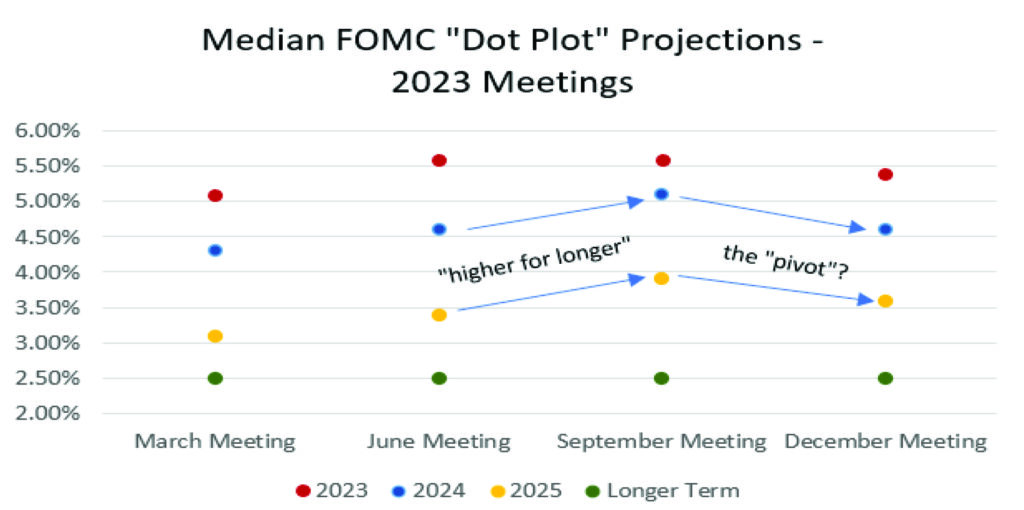
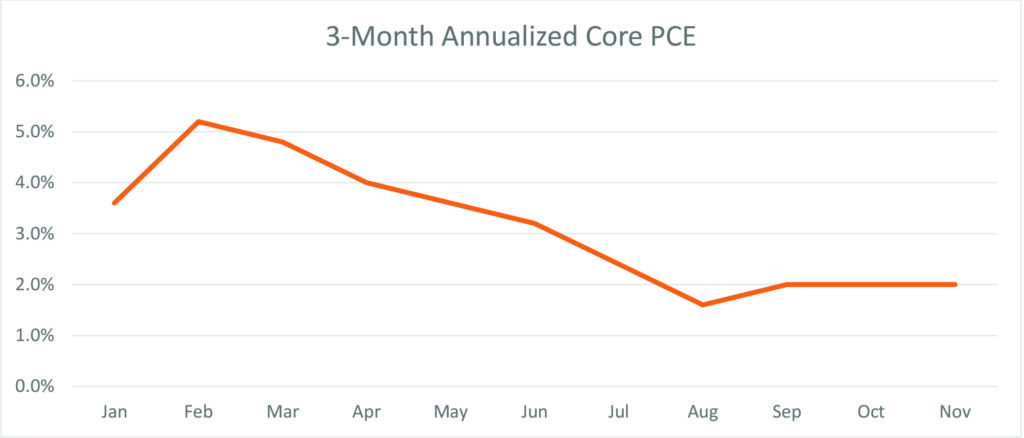
The reason for the Fed’s pivot towards lower expected interest rates is several months’ worth of improving inflation data. While the Fed’s preferred inflation metric, Core Personal Consumption Expenditure Index (Core PCE) is still at 3.2% annually, much of that inflation is attributable to the early months of the year. The trend in more recent months is towards much lower inflation. Fed Chairman Jerome Powell has noted the importance of more recent data relative to older data points, and has suggested a 3-month annualized measure as a more accurate depictor of current inflation. By that metric, Core PCE inflation has been steady around 2% since July, and seems to satisfy the Fed’s demand for persistent improvement on inflation towards the 2% target.
Exhibit 2. 3-Month Annualized Core Personal Consumption Expenditures
While the Fed would love to save face and keep rates at current levels through mid-year 2024, it would be prudent to begin rate cuts as soon as possible. Keeping rates elevated at over 5.25% could create systemic risks to the financial sector, which we had a taste of in the spring of 2023 when several regional banks collapsed. The Fed needs to be flexible with interest rate policy or risk putting unnecessary strain on the financial sector which is trying to navigate a significant decline in commercial real estate values that are the collateral for billions in loans and underwater US Treasury balance sheet holdings due to Fed interest rate policy, causing bank balance sheet duration mismanagement.
The inflation data should provide the Fed with reason to start cutting rates in March, because if we get a few more monthly inflation readings of 0.1% or less, the year-over-year inflation rate will quickly fall below 2%. That headline will give the Fed plenty of cover to issue its first rate cut and revise its forecasts to include further cuts beyond the 75 basis points already projected.
Market Commentary
The fourth quarter began with markets still in the sell-off from the late-July highs that ultimately took the S&P 500 down -9.5% from peak-to-trough. Perceived dovishness from Chairman Powell at the November Fed meeting was the impetus for a reversal which has propelled equities to new 2023 highs. The most encouraging aspect of the market’s dramatic recovery in the last two months is the broadening of the rally beyond the mega-cap “magnificent seven” stocks to include all sectors and all market cap size companies.
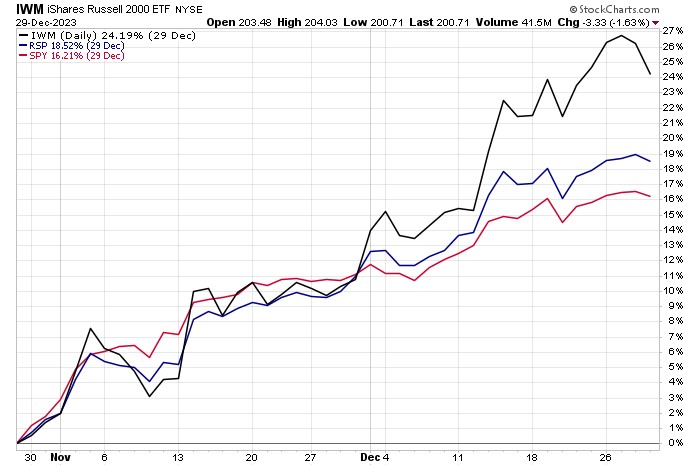
Through most of the year, and especially the last quarter, we have believed it wise for investors to begin accumulating exposure to small and mid-cap stocks, based on their abnormally low valuations relative to large cap stocks. From the October 27th low to year-end 2023, the small cap Russell 2000 index surged 24.2%, outpacing the S&P 500’s 16.2% gain. This is a very encouraging sign that the market can continue to advance into the new year, since the lack of market breadth was the reason the summer rally fizzled out and collapsed. For investors who deem small and mid-caps too aggressive for their risk appetite, diversifying into an equal-weight version of the S&P 500 could also be a winning strategy as market breadth expands. From the October 27th bottom, the Invesco S&P 500 Equal Weight ETF (RSP) has slightly outperformed the S&P 500 with a 18.5% gain.
Exhibit 3. Russell 2000 (IWM), S&P 500 Equal Weight (RSP), and S&P 500 (SPY) performance since October 27th, 2023
Outside the US, stocks have also recovered to end the year, with Developed International Markets up 15.9% from the October bottom through year end, as measured by the iShares MCSI EAFE ETF (EFA). With inflation following a similar downward trajectory in Europe as in the US, Developed International stocks should behave in somewhat correlated fashion in 2024, and possibly outperform as investors continue to rotate out of US mega caps. The outlook is much more challenging for Emerging Markets, due to high uncertainty over the property market and alarming levels of youth unemployment in China. 2023 proved to be yet another year of underperformance for Emerging Market stocks, with the iShares MSCI Emerging Market ETF (EEM) trailing the S&P 500 by -17.3% and the Nasdaq by a staggering -34.4% for the year.
Bond investors who blinked missed 10-Year US Treasury yields at 5%, which came and went on October 19th, and may not return for a long time. Since then, 10-Year US Treasury yields have been in free-fall, at times dipping under 3.8%. Investors who were waiting to lock in the Fed’s rate hikes for 10 years or longer have seen the opportunity quickly vanish, and now a panic to secure higher yields before rate cuts commence is creating heavy demand and thus downward pressure on interest rates. From the October 19th peak in interest rates, the iShares 20+ Year Treasury ETF (TLT) has rallied 20.6%.
We have been proponents of high yield bonds for most of the year given our expectations that the recession forecasters were wrong, and the asset class has continued to deliver solid returns as more investors come around to the realization that the Fed may pull off the soft landing. With interest rates poised to fall, financing becomes more affordable to high yield borrowers and the risk of defaults declines amidst a growing economy with full employment. High yield bonds, as measured by the iShares iBoxx US High Yield ETF (HYG), returned a solid 11.5% in 2023.
Closing Remarks
There is some concern that the rally has been too far, too fast, given that it took just 23 trading days off the bottom to erase losses that accumulated over the preceding 63 trading days. While there is some validity to this argument and some technical indicators support the assertion that markets are overbought, there is also an argument to be made that the broader, more even distribution of the recent gains beyond the “Mag 7” stocks is a testament to the rally’s staying power. We have cautioned investors waiting for a rate cut that the bulk of the gains would occur not on the cut, but on the pivot in the Fed’s messaging. With the lower revisions to the Dot Plot and some subtle dovish undertones to recent Fed comments, we believe that moment has arrived.
Thank you, as always, for the opportunity to serve you.
Vestbridge Advisors, Inc. (“VB”) Is registered with the US Securities and Exchange Commission as a registered investment advisor with principal offices at 3393 Bargaintown Road, Egg Harbor Township, NJ. The information contained in this publication is meant for informational purposes only and does not constitute a direct offer to any individual or entity for the sale of securities or advisory services. Advisory advice is provided to individuals and entities in those states in which VB is authorized to do business. For more detailed information on VB, please visit our website at www.Vestbridge.com and view our Privacy Policy and our ADV2 Disclosure Document that contains relevant information about VB. Although VB is a fairly new organization, any references herein to the experience of the firm and its staff relates to prior experience with affiliated and nonaffiliated entities in similar investment related activities. All statistical information contained herein was believed to be the most current available at the time of the publishing of this publication.